Rogers 2005 Annual Report Download - page 92
Download and view the complete annual report
Please find page 92 of the 2005 Rogers annual report below. You can navigate through the pages in the report by either clicking on the pages listed below, or by using the keyword search tool below to find specific information within the annual report.-
 1
1 -
2
-
3
-
4
-
5
-
6
-
7
-
8
-
9
-
10
-
11
-
12
-
13
-
14
-
15
-
16
-
17
-
18
-
19
-
20
-
21
-
22
-
23
-
24
-
25
-
26
-
27
-
28
-
29
-
30
-
31
-
32
-
33
-
34
-
35
-
36
-
37
-
38
-
39
-
40
-
41
-
42
-
43
-
44
-
45
-
46
-
47
-
48
-
49
-
50
-
51
-
52
-
53
-
54
-
55
-
56
-
57
-
58
-
59
-
60
-
61
-
62
-
63
-
64
-
65
-
66
-
67
-
68
-
69
-
70
-
71
-
72
-
73
-
74
-
75
-
76
-
77
-
78
-
79
-
80
-
81
-
 82
82 -
 83
83 -
 84
84 -
 85
85 -
 86
86 -
 87
87 -
 88
88 -
 89
89 -
 90
90 -
 91
91 -
 92
92 -
 93
93 -
 94
94 -
 95
95 -
 96
96 -
 97
97 -
 98
98 -
 99
99 -
 100
100 -
 101
101 -
 102
102 -
103
-
104
-
105
-
106
-
107
-
108
-
109
-
110
-
111
-
112
-
113
-
114
-
115
-
116
-
117
-
118
-
119
-
120
-
121
-
122
-
123
-
124
-
125
-
126
-
127
-
128
-
129
-
130
-
131
-
132
-
133
-
134
-
135
-
136
-
137
-
138
-
139
-
140
-
141
-
142
-
143
-
144
-
145
-
146
-
147
-
148
-
149
-
150
-
151
-
152
-
153
-
154
 |
 |

88 ROGERS 2005 ANNUAL REPORT . MANAGEMENT’S DISCUSSION AND ANALYSIS OF FINANCIAL CONDITION AND RESULTS OF OPERATIONS
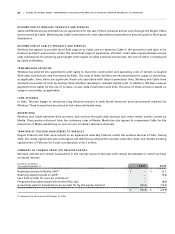
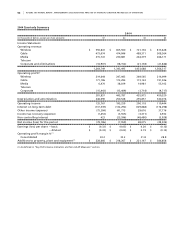
(2) Supplemental Media detail:
2006
(In millions of dollars) 2 0 0 5 Range
Revenue
Core Media $ 937 $ 1,000 to $ 1,030
Sports Entertainment 160 165 to 175
Operating Profit
Core Media $ 139 $ 145 to $ 155
Sports Entertainment (11) (30) to (35)
(3) Before RCI corporate expenses and management fees paid to RCI, and excluding costs associated with the integration of Fido and Call-Net.
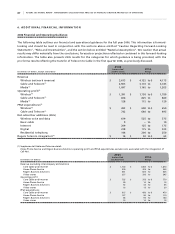
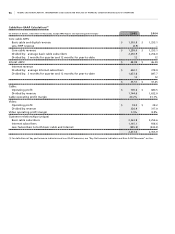
(4) Supplemental Wireless detail:
Excludes one time expenditures related to the integration of Fido in 2005 as well as up to $80 million of PP&E expenditures and up to
$20 million in operating losses related to the Inukshuk fixed wireless initiative in 2006.
2006
(In millions of dollars) 2 0 0 5 Range
PP&E expenditures
Wireless (excl. HSDPA) $ 492 $ 450 to $ 475
HSDPA – 150 to 175
(5) Does not include Corporate or Media PP&E expenditures or the PP&E expenditures component of the Call-Net integration. Corporate PP&E
expenditures will include costs associated with the January 4, 2006 purchase of the Greater Toronto Area business campus by RCI.
(6) Estimated 2006 breakdown: approximately 70% to be recorded as PP&E expenditures and approximately 30% to be recorded as operating
expense.
MA T E RI A L A SS U M PT I ON S
Certain key macro assumptions were made in the preparation of our annual 2006 guidance, the most significant of
which include:
• Canadian GDP growth of approximately 3% for 2006, with the Canadian Consumer Price Index rising modestly from
the current level of approximately 2%;
• A relatively stable foreign exchange rate of C$1.18 = US$1.00 based upon a general consensus of economists’ currency
forecasts;
• Growth in the overall Canadian telecommunications market in 2006 modestly higher than GDP growth;
• A revenue growth rate for the Canadian wireless industry of approximately 13% to 15% which is slightly below the
2005 growth rate, with a wireless industry penetration gain similar to modestly below the gain in 2005;
• Revenue growth rates for the overall Canadian video and Internet markets equal to or slightly lower than the 2005
growth rates of approximately 6% and 12%, respectively;
• A modest decrease in the overall Canadian residential and business voice telecommunications markets consistent with
2005 due to competitive pricing pressures, wireless substitution, and other factors;
• No material changes in the overall Canadian advertising market; and
• No significant degree of consolidation, fragmentation or other such changes in the Canadian communications or
media industries.