Rogers 2005 Annual Report Download - page 144
Download and view the complete annual report
Please find page 144 of the 2005 Rogers annual report below. You can navigate through the pages in the report by either clicking on the pages listed below, or by using the keyword search tool below to find specific information within the annual report.-
 1
1 -
2
-
3
-
4
-
5
-
6
-
7
-
8
-
9
-
10
-
11
-
12
-
13
-
14
-
15
-
16
-
17
-
18
-
19
-
20
-
21
-
22
-
23
-
24
-
25
-
26
-
27
-
28
-
29
-
30
-
31
-
32
-
33
-
34
-
35
-
36
-
37
-
38
-
39
-
40
-
41
-
42
-
43
-
44
-
45
-
46
-
47
-
48
-
49
-
50
-
51
-
52
-
53
-
54
-
55
-
56
-
57
-
58
-
59
-
60
-
61
-
62
-
63
-
64
-
65
-
66
-
67
-
68
-
69
-
70
-
71
-
72
-
73
-
74
-
75
-
76
-
77
-
78
-
79
-
80
-
81
-
82
-
83
-
84
-
85
-
86
-
87
-
88
-
89
-
90
-
91
-
92
-
93
-
94
-
95
-
96
-
97
-
98
-
99
-
100
-
101
-
102
-
103
-
104
-
105
-
106
-
107
-
108
-
109
-
110
-
111
-
112
-
113
-
114
-
115
-
116
-
117
-
118
-
119
-
120
-
121
-
122
-
123
-
124
-
125
-
126
-
127
-
128
-
129
-
130
-
131
-
132
-
133
-
 134
134 -
 135
135 -
 136
136 -
 137
137 -
 138
138 -
 139
139 -
 140
140 -
 141
141 -
 142
142 -
 143
143 -
 144
144 -
 145
145 -
 146
146 -
 147
147 -
 148
148 -
 149
149 -
 150
150 -
 151
151 -
 152
152 -
 153
153 -
 154
154
 |
 |

140 ROGERS 2005 ANNUAL REPORT . NOTES TO CONSOLIDATED FINANCIAL STATEMENTS
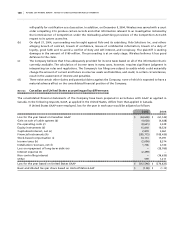
The cumulative effect of these adjustments on the consolidated shareholders’ equity of the Company is as follows:
2005 2004
Shareholders’ equity based on Canadian GAAP $ 3,527,615 $ 2,385,334
Gain on sale and issuance of subsidiary shares to non-controlling interest (a) 46,245 46,245
Gain on sale of cable systems (b) 116,909 120,937
Pre-operating costs (c) (12,127) (3,506)
Equity instruments (d) – (98,098)
Capitalized interest (e) 43,927 41,047
Unrealized holding gains on investments (f) 139,384 152,267
Acquisition of Cable Atlantic (g) 34,673 34,673
Financial instruments (h) (533,788) (248,013)
Minimum pension liability (j) (20,423) (20,970)
Income taxes (k) (253,567) (253,567)
Installation revenues, net (l) 4,450 2,744
Loss on repayment of long-term debt (m) (28,760) (28,760)
Acquisition of Wireless (n) 3,095 2,927
Non-controlling interest effect of adjustments (95,031) (95,031)
Other (15,270) (15,829)
Shareholders’ equity based on United States GAAP $ 2,957,332 $ 2,022,400
The areas of material difference between Canadian and United States GAAP and their impact on the consolidated financial
statements of the Company are described below:
(a ) G AI N ON SA L E A N D I SS U AN C E O F S U BS I D IA R Y S HA R E S T O N ON - C ON T RO L LI N G I N TE R EST :
Under United States GAAP, the carrying value of the Company’s investment in Wireless would be lower than the carrying
value under Canadian GAAP as a result of certain differences between Canadian and United States GAAP, as described
herein. This results in an increase to the gain on sale and dilution under United States GAAP.
(b ) GA I N O N S A LE OF C AB L E S YST E MS :
Under Canadian GAAP, the cash proceeds on the non-monetary exchange of the cable assets in 2000 were recorded as
a reduction in the carrying value of PP&E. Under United States GAAP, a portion of the cash proceeds received must be
recognized as a gain in the consolidated statements of income on an after-tax basis. The gain amounted to $40.3 million
before income taxes.
Under Canadian GAAP, the after-tax gain arising on the sale of certain of the Company’s cable television
systems in prior years was recorded as a reduction of the carrying value of goodwill acquired in a contemporaneous
acquisition of certain cable television systems. Under United States GAAP, the Company included the gain on sale of the
cable television systems in income, net of related future income taxes.
As a result of these transactions, amortization expense under United States GAAP was increased in subsequent
years.
(c ) P R E-O P ER A TI N G C O ST S :
Under Canadian GAAP, the Company defers the incremental costs relating to the development and pre-operating phases
of new businesses and amortizes these costs on a straight-line basis over periods up to five years. Under United States
GAAP, these costs are expensed as incurred.
(d ) EQ U IT Y IN S TR U MEN T S:
Under Canadian GAAP, the fair value of the liability component of the Convertible Preferred Securities of $388.0 million at
the date of issuance was recorded as long-term debt. This liability component was being accreted up to the $600.0 million
face value of the Convertible Preferred Securities over the term to maturity. This accretion was charged to interest expense.
Under Canadian GAAP, the value of the conversion feature of $188.0 million was recorded in shareholders’ equity.