Reebok 2009 Annual Report Download - page 95
Download and view the complete annual report
Please find page 95 of the 2009 Reebok annual report below. You can navigate through the pages in the report by either clicking on the pages listed below, or by using the keyword search tool below to find specific information within the annual report.-
 1
1 -
2
-
3
-
4
-
5
-
6
-
7
-
8
-
9
-
10
-
11
-
12
-
13
-
14
-
15
-
16
-
17
-
18
-
19
-
20
-
21
-
22
-
23
-
24
-
25
-
26
-
27
-
28
-
29
-
30
-
31
-
32
-
33
-
34
-
35
-
36
-
37
-
38
-
39
-
40
-
41
-
42
-
43
-
44
-
45
-
46
-
47
-
48
-
49
-
50
-
51
-
52
-
53
-
54
-
55
-
56
-
57
-
58
-
59
-
60
-
61
-
62
-
63
-
64
-
65
-
66
-
67
-
68
-
69
-
70
-
71
-
72
-
73
-
74
-
75
-
76
-
77
-
78
-
79
-
80
-
81
-
82
-
83
-
84
-
 85
85 -
 86
86 -
 87
87 -
 88
88 -
 89
89 -
 90
90 -
 91
91 -
 92
92 -
 93
93 -
 94
94 -
 95
95 -
 96
96 -
 97
97 -
 98
98 -
 99
99 -
 100
100 -
 101
101 -
 102
102 -
 103
103 -
 104
104 -
 105
105 -
106
-
107
-
108
-
109
-
110
-
111
-
112
-
113
-
114
-
115
-
116
-
117
-
118
-
119
-
120
-
121
-
122
-
123
-
124
-
125
-
126
-
127
-
128
-
129
-
130
-
131
-
132
-
133
-
134
-
135
-
136
-
137
-
138
-
139
-
140
-
141
-
142
-
143
-
144
-
145
-
146
-
147
-
148
-
149
-
150
-
151
-
152
-
153
-
154
-
155
-
156
-
157
-
158
-
159
-
160
-
161
-
162
-
163
-
164
-
165
-
166
-
167
-
168
-
169
-
170
-
171
-
172
-
173
-
174
-
175
-
176
-
177
-
178
-
179
-
180
-
181
-
182
-
183
-
184
-
185
-
186
-
187
-
188
-
189
-
190
-
191
-
192
-
193
-
194
-
195
-
196
-
197
-
198
-
199
-
200
-
201
-
202
-
203
-
204
-
205
-
206
-
207
-
208
-
209
-
210
-
211
-
212
-
213
-
214
-
215
-
216
-
217
-
218
-
219
-
220
-
221
-
222
-
223
-
224
-
225
-
226
-
227
-
228
-
229
-
230
-
231
-
232
-
233
-
234
 |
 |
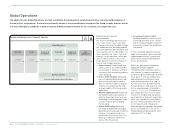
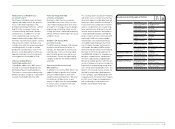
GROUP MANAGEMENT REPORT – OUR GROUP Global Operations 91
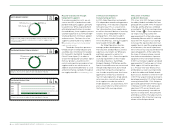
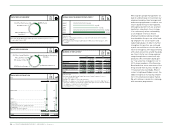
Volume of apparel production declines
In 2009, we sourced 83% of the total
apparel volume for adidas, Reebok
and adidas Golf from Asia (2008: 83%).
Europe remained the second largest
apparel sourcing region, represent-
ing 11% of the volume (2008: 12%). The
Americas accounted for 6% of the volume
(2008: 5%) see 05. China was the larg-
est source country, representing 37% of
the produced volume, followed by Thai-
land with 14% and Indonesia with 11%.
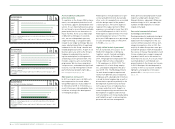
In total, our suppliers produced approxi-
mately 239 million units of apparel in
2009 (2008: approx. 284 million units)
see 06. The largest apparel factory
produced approximately 11% of this
apparel volume in 2009 (2008: 10%). In
addition, Reebok-CCM Hockey sourced
around 2 million units of apparel in 2009.
The majority of this volume was also
produced in Asia, while small portions
were sourced from the Americas (par-
ticularly Canada) and Europe. The Sports
Licensed Division sourced approximately
20 million units of apparel and 14 million
units of headwear (2008: 22 million and
17 million, respectively). The majority
of purchased apparel products was
sourced as unfinished goods from Latin
America (62%) and Asia (8%), and was
subsequently finished in our own screen-
printing facilities in the USA. The majority
of headwear sourced was finished prod-
ucts manufactured predominately in Asia
(96%) and the USA (4%).
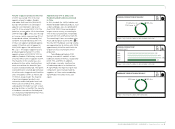
Approximately 67% of adidas and
Reebok branded hardware produced
in China
In 2009, the bulk (i.e. 98%) of adidas and
Reebok branded hardware products, such
as balls and bags, was also produced in
Asia (2008: 98%). China remained our
largest source country, accounting for
67% of the sourced volume, followed by
Vietnam with 22% and Pakistan with 8%.
The remaining 3% was sourced via other
Asian and European countries see 07.
The total 2009 hardware sourcing volume
was approximately 34 million units (2008:
approximately 42 million units) with the
largest factory accounting for 28% of
production.
TaylorMade and Reebok-CCM
Hockey sourced 92% and 88% of their
hardware volumes from Asia, respectively
(2008: 93% and 75%). In addition,
both brands sourced a small portion
of hardware products in the Americas.
At TaylorMade, the majority of golf club
components were manufactured by
suppliers in China and assembled by
TaylorMade in the USA, China and
Japan.
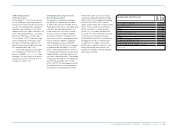
1) Figures only include the adidas and Reebok brands.
N
°-
07
HARDWARE PRODUCTION BY REGION 1 )
2% Europe 98% Asia
1) Figures only include the adidas, Reebok and adidas Golf brands.
N
°-
05
APPAREL PRODUCTION BY REGION 1 )
6% Americas
11% Europe
83% Asia
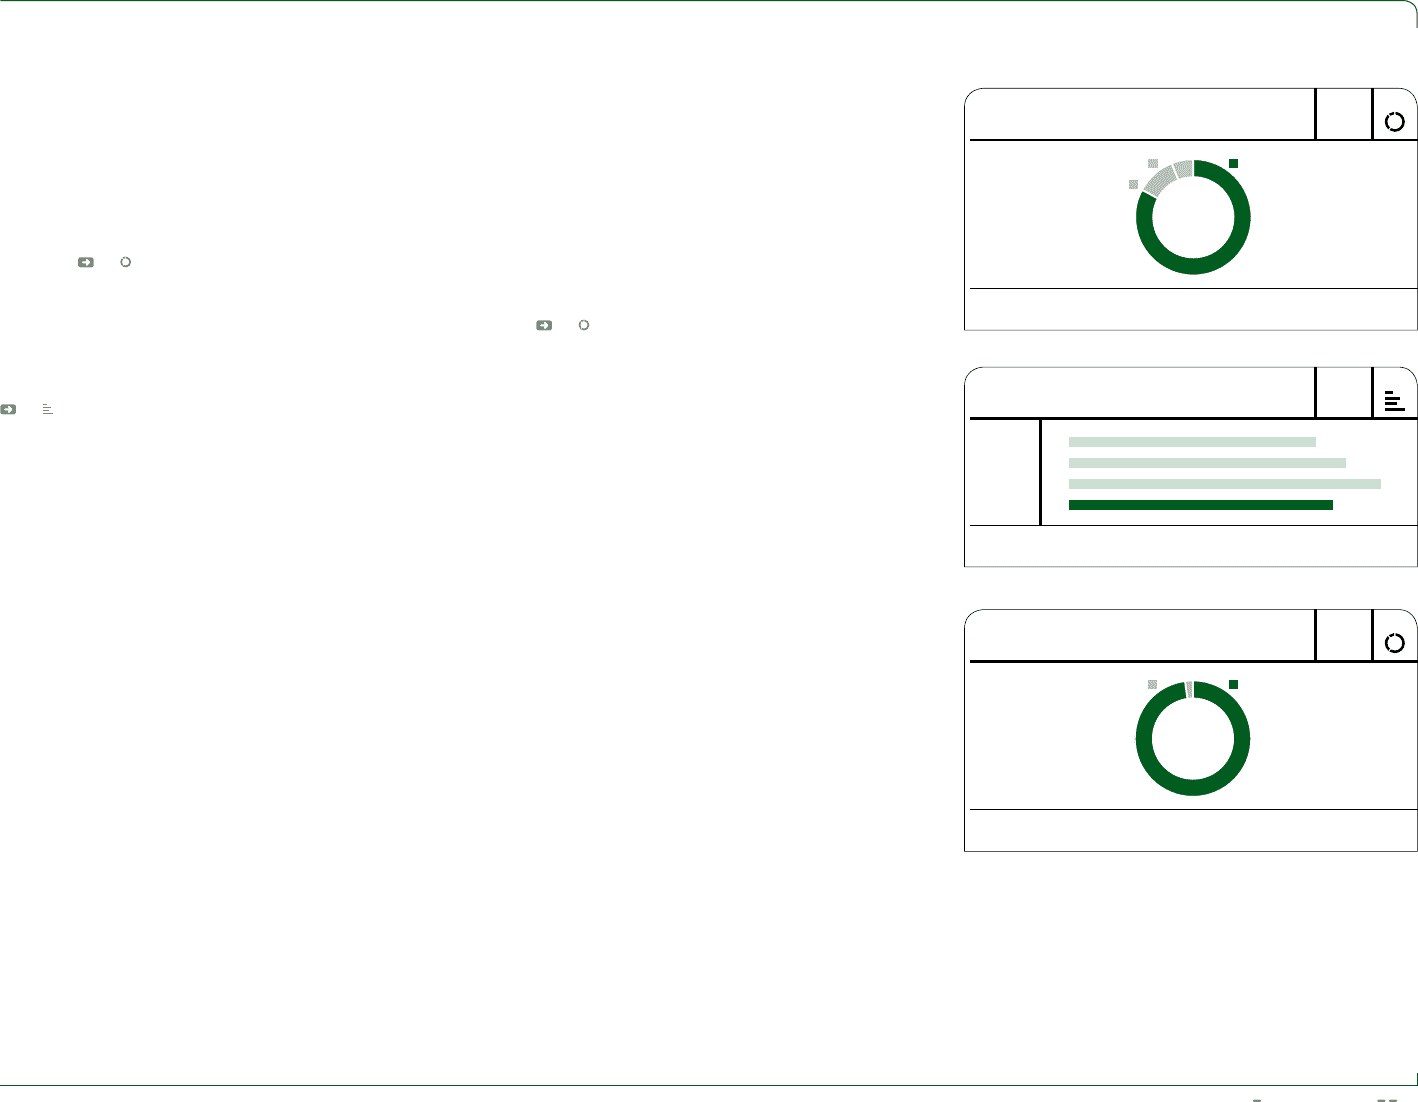
N
°-
06
APPAREL PRODUCTION 1 )
IN MILLION UNITS
2006
2007
2008
2009
225
252
284
239
1) Figures only include the adidas, Reebok and adidas Golf brands.