Reebok 2009 Annual Report Download - page 209
Download and view the complete annual report
Please find page 209 of the 2009 Reebok annual report below. You can navigate through the pages in the report by either clicking on the pages listed below, or by using the keyword search tool below to find specific information within the annual report.-
 1
1 -
2
-
3
-
4
-
5
-
6
-
7
-
8
-
9
-
10
-
11
-
12
-
13
-
14
-
15
-
16
-
17
-
18
-
19
-
20
-
21
-
22
-
23
-
24
-
25
-
26
-
27
-
28
-
29
-
30
-
31
-
32
-
33
-
34
-
35
-
36
-
37
-
38
-
39
-
40
-
41
-
42
-
43
-
44
-
45
-
46
-
47
-
48
-
49
-
50
-
51
-
52
-
53
-
54
-
55
-
56
-
57
-
58
-
59
-
60
-
61
-
62
-
63
-
64
-
65
-
66
-
67
-
68
-
69
-
70
-
71
-
72
-
73
-
74
-
75
-
76
-
77
-
78
-
79
-
80
-
81
-
82
-
83
-
84
-
85
-
86
-
87
-
88
-
89
-
90
-
91
-
92
-
93
-
94
-
95
-
96
-
97
-
98
-
99
-
100
-
101
-
102
-
103
-
104
-
105
-
106
-
107
-
108
-
109
-
110
-
111
-
112
-
113
-
114
-
115
-
116
-
117
-
118
-
119
-
120
-
121
-
122
-
123
-
124
-
125
-
126
-
127
-
128
-
129
-
130
-
131
-
132
-
133
-
134
-
135
-
136
-
137
-
138
-
139
-
140
-
141
-
142
-
143
-
144
-
145
-
146
-
147
-
148
-
149
-
150
-
151
-
152
-
153
-
154
-
155
-
156
-
157
-
158
-
159
-
160
-
161
-
162
-
163
-
164
-
165
-
166
-
167
-
168
-
169
-
170
-
171
-
172
-
173
-
174
-
175
-
176
-
177
-
178
-
179
-
180
-
181
-
182
-
183
-
184
-
185
-
186
-
187
-
188
-
189
-
190
-
191
-
192
-
193
-
194
-
195
-
196
-
197
-
198
-
 199
199 -
 200
200 -
 201
201 -
 202
202 -
 203
203 -
 204
204 -
 205
205 -
 206
206 -
 207
207 -
 208
208 -
 209
209 -
 210
210 -
 211
211 -
 212
212 -
 213
213 -
 214
214 -
 215
215 -
 216
216 -
 217
217 -
 218
218 -
 219
219 -
220
-
221
-
222
-
223
-
224
-
225
-
226
-
227
-
228
-
229
-
230
-
231
-
232
-
233
-
234
 |
 |
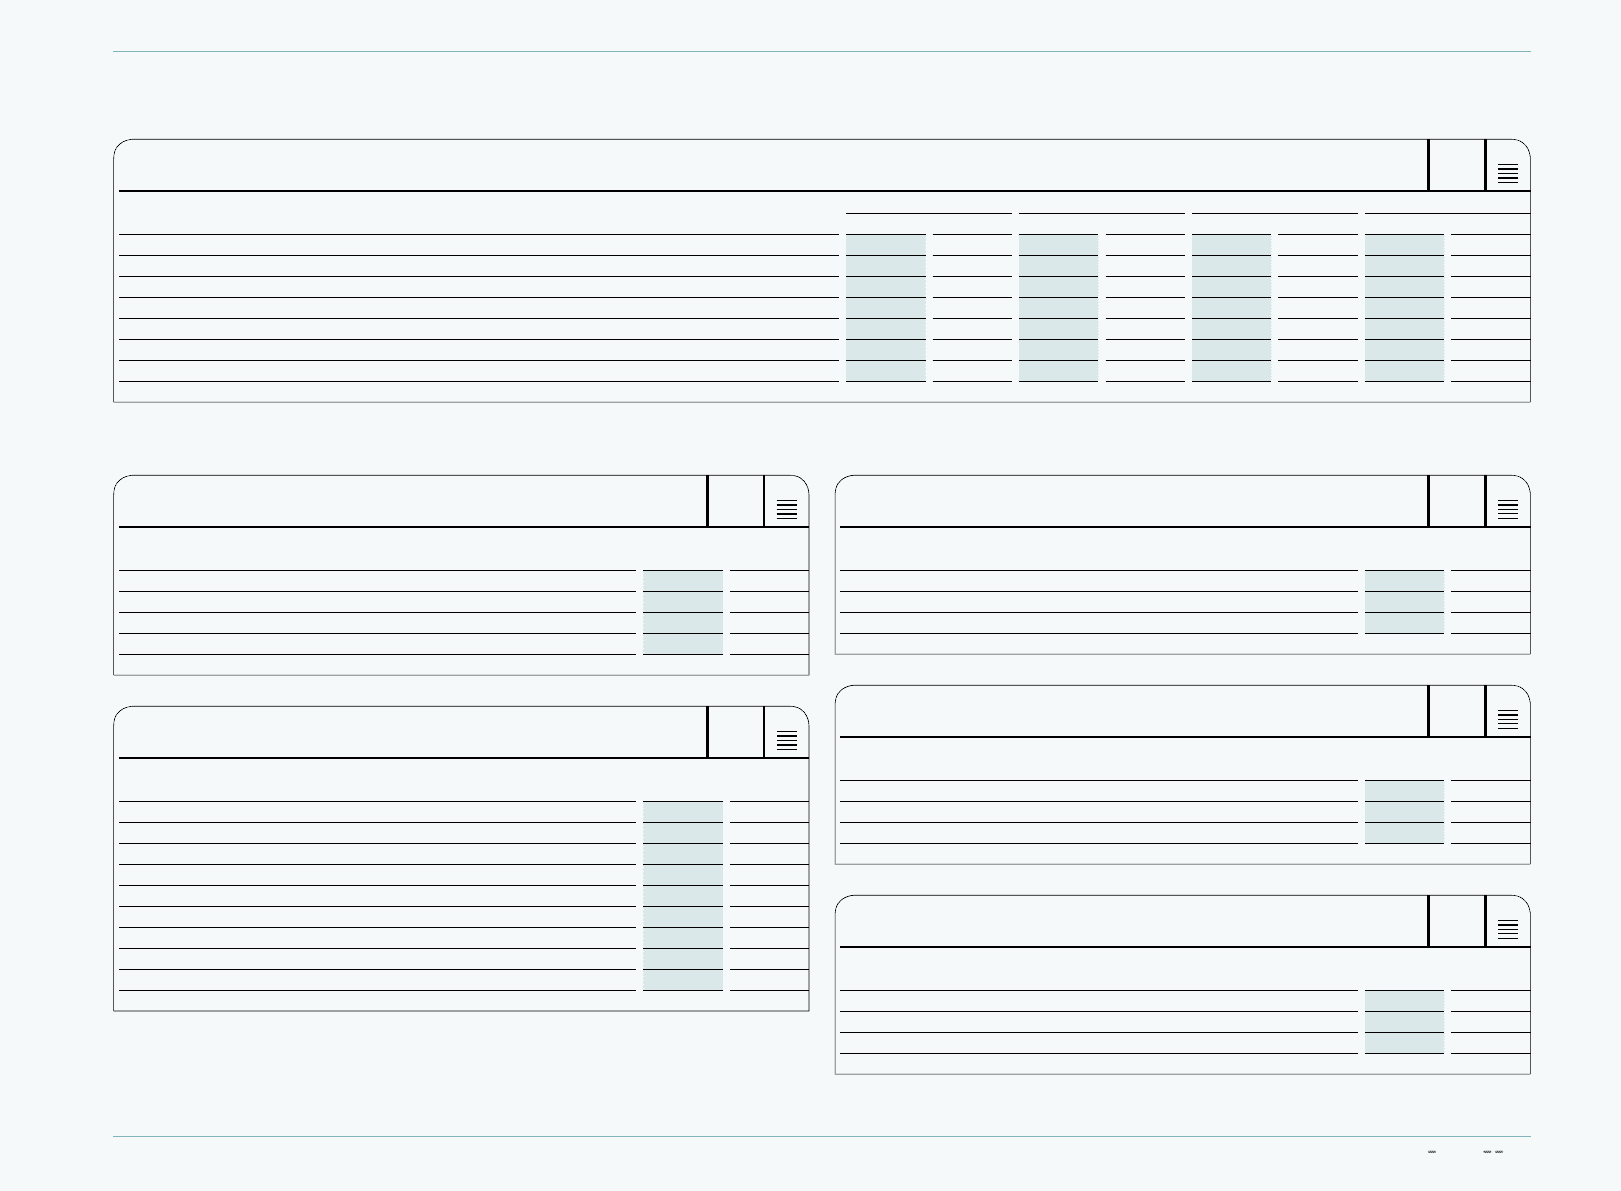
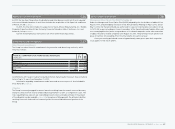
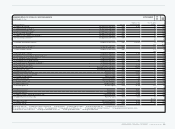
CONSOLIDATED FINANCIAL STATEMENTS Notes 205
N
°-
35
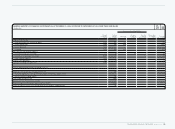
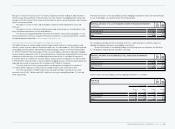
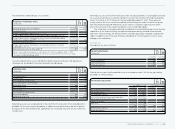
REPORTABLE SEGMENTS
€ IN MILLIONS
Wholesale Retail Other Businesses Total Segments
2009 2008 2009 2008 2009 2008 2009 2008
Net sales (non-Group) 7,174 7,758 1,906 1,738 1,283 1,285 10,363 10,781
Segmental operating profit 2,346 2,692 267 326 281 337 2,894 3,355
Segmental assets 1,943 2,401 429 427 415 578 2,787 3,406
Segmental liabilities 470 492 37 30 74 64 581 586
Capital expenditure 24 26 71 137 14 18 109 181
Scheduled depreciation and amortisation 24 26 88 66 6 5 118 97
Impairment 0 2 14 3 0 0 14 5
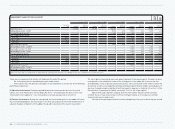
Reconciliations Reconciliations
N
°-
35
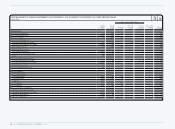
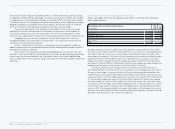
NET SALES
€ IN MILLIONS
Year ending
Dec. 31, 2009 Year ending
Dec. 31, 2008
Total net sales (non-Group) for reportable segments 10,363 10,781
HQ 2 18
Consolidation 16 0
Net sales 10,381 10,799
N
°-
35
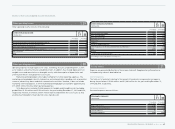
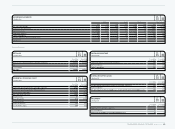
SEGMENTAL OPERATING PROFIT
€ IN MILLIONS
Year ending
Dec. 31, 2009 Year ending
Dec. 31, 2008
Segmental operating profit for reportable segments 2,894 3,355
Segmental operating profit for HQ/Consolidation 41 177
Marketing working budget 1,028 1,132
Other operating expenses 1,485 1,419
Royalty income 86 89
Operating profit 508 1,070
Financial income 19 37
Financial expenses 169 203
Income before taxes 358 904
N
°-
35
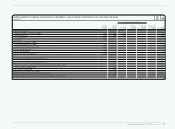
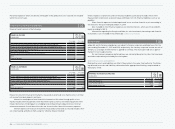
CAPITAL EXPENDITURE
€ IN MILLIONS
Year ending
Dec. 31, 2009 Year ending
Dec. 31, 2008
Capital expenditure of reportable segments 109 181
HQ/Consolidation 131 199
Capital expenditure 240 380
N
°-
35
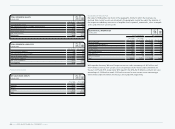
SCHEDULED DEPRECIATION
€ IN MILLIONS
Year ending
Dec. 31, 2009 Year ending
Dec. 31, 2008
Scheduled depreciation/amortisation of reportable segments 118 97
HQ/Consolidation 141 125
Scheduled depreciation on tangible assets and amortisation on intangible assets 259 222
N
°-
35
IMPAIRMENT
€ IN MILLIONS
Year ending
Dec. 31, 2009 Year ending
Dec. 31, 2008
Impairment of reportable segments 14 5
HQ/Consolidation 21 1
Impairment of tangible assets and intangible assets 35 6