Reebok 2009 Annual Report Download - page 133
Download and view the complete annual report
Please find page 133 of the 2009 Reebok annual report below. You can navigate through the pages in the report by either clicking on the pages listed below, or by using the keyword search tool below to find specific information within the annual report.-
 1
1 -
2
-
3
-
4
-
5
-
6
-
7
-
8
-
9
-
10
-
11
-
12
-
13
-
14
-
15
-
16
-
17
-
18
-
19
-
20
-
21
-
22
-
23
-
24
-
25
-
26
-
27
-
28
-
29
-
30
-
31
-
32
-
33
-
34
-
35
-
36
-
37
-
38
-
39
-
40
-
41
-
42
-
43
-
44
-
45
-
46
-
47
-
48
-
49
-
50
-
51
-
52
-
53
-
54
-
55
-
56
-
57
-
58
-
59
-
60
-
61
-
62
-
63
-
64
-
65
-
66
-
67
-
68
-
69
-
70
-
71
-
72
-
73
-
74
-
75
-
76
-
77
-
78
-
79
-
80
-
81
-
82
-
83
-
84
-
85
-
86
-
87
-
88
-
89
-
90
-
91
-
92
-
93
-
94
-
95
-
96
-
97
-
98
-
99
-
100
-
101
-
102
-
103
-
104
-
105
-
106
-
107
-
108
-
109
-
110
-
111
-
112
-
113
-
114
-
115
-
116
-
117
-
118
-
119
-
120
-
121
-
122
-
 123
123 -
 124
124 -
 125
125 -
 126
126 -
 127
127 -
 128
128 -
 129
129 -
 130
130 -
 131
131 -
 132
132 -
 133
133 -
 134
134 -
 135
135 -
 136
136 -
 137
137 -
 138
138 -
 139
139 -
 140
140 -
 141
141 -
 142
142 -
 143
143 -
144
-
145
-
146
-
147
-
148
-
149
-
150
-
151
-
152
-
153
-
154
-
155
-
156
-
157
-
158
-
159
-
160
-
161
-
162
-
163
-
164
-
165
-
166
-
167
-
168
-
169
-
170
-
171
-
172
-
173
-
174
-
175
-
176
-
177
-
178
-
179
-
180
-
181
-
182
-
183
-
184
-
185
-
186
-
187
-
188
-
189
-
190
-
191
-
192
-
193
-
194
-
195
-
196
-
197
-
198
-
199
-
200
-
201
-
202
-
203
-
204
-
205
-
206
-
207
-
208
-
209
-
210
-
211
-
212
-
213
-
214
-
215
-
216
-
217
-
218
-
219
-
220
-
221
-
222
-
223
-
224
-
225
-
226
-
227
-
228
-
229
-
230
-
231
-
232
-
233
-
234
 |
 |
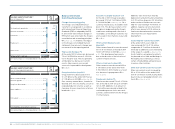
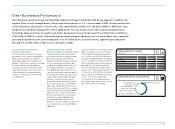
Long-term financial flexibility ensured
The adidas Group’s long-term flexibility
is ensured by unutilised credit facilities
in an amount of € 4.135 billion at the
end of 2009 (2008: € 3.974 billion). These
include a € 2.000 billion committed
multi-year syndicated loan which was not
utilised at year-end (2008: € 1.801 bil-
lion unutilised) as well as bilateral credit
lines at different banks in an amount
of € 2.135 billion (2008: € 2.173 billion).
We monitor the ongoing need for avail-
able credit lines based on the current
level of debt as well as future financing
requirements.
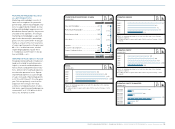
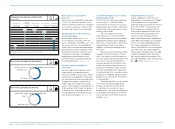
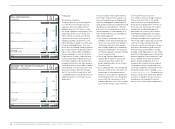
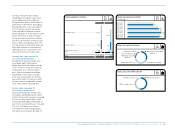
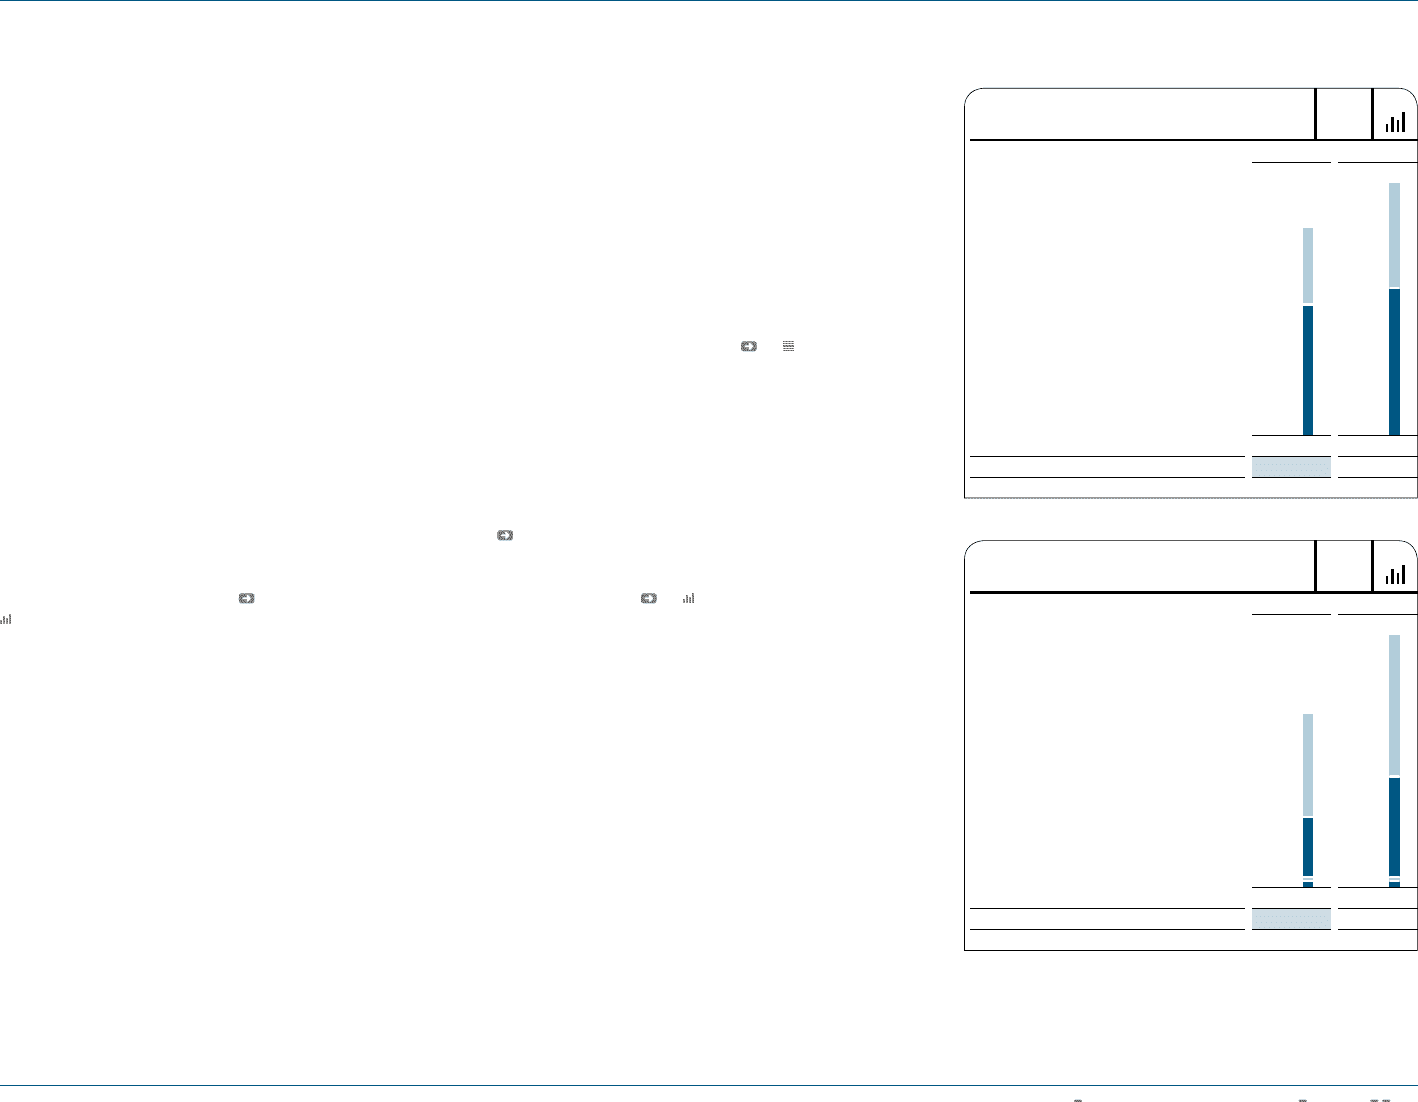
Short-term credit lines decrease
Short-term credit lines declined 18% to
€ 2.238 billion at the end of 2009 from
€ 2.722 billion in the prior year. Credit
lines decreased in line with lower financ-
ing needs. Committed and uncommitted
credit lines represent approximately 37%
and 63% of total short-term credit lines,
respectively (2008: 42% and 58%) see
47.
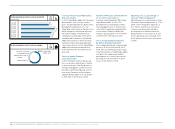
Standard financial covenants
In the case of our committed credit
facilities, we have entered into various
covenants. These covenants may include
limits on the disposal of fixed assets, the
amount of debt secured by liens, cross
default provisions and change of control.
In addition, certain financial arrange-
ments contain equity ratio covenants,
minimum equity covenants as well as
net loss covenants. If we fail to meet
any covenant and are unable to obtain
a waiver from a majority of partner
banks, borrowings would become due
and payable immediately. As at Decem-
ber 31, 2009, we were in full compliance
with all of our covenants, with ample
coverage above all stipulated minimum
requirements. As a result of our cash
flow expectations, we are confident we
will continue to be compliant with these
covenants going forward see Subse-
quent Events and Outlook, p. 156. We currently
believe that cash generated by opera-
tions, together with access to external
sources of funds, will be sufficient to
meet our future operating and capital
needs.
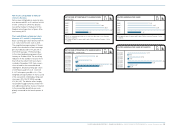
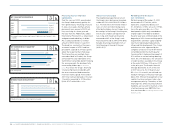
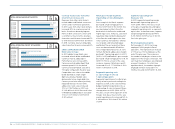
Gross borrowings decrease
significantly
Gross borrowings decreased 31% to
€ 1.767 billion at the end of 2009 from
€ 2.573 billion in the prior year. Bank
borrowings declined 83% to € 103 mil-
lion from € 605 million in the prior year.
Our private placements in the USA, in
Europe and in Asia decreased 19% to
€ 1.166 billion in 2009 (2008: € 1.432 bil-
lion). Bonds outstanding increased 27%
and amounted to € 498 million (2008:
€ 393 million) see 52. No commercial
paper was outstanding at the end of 2009
(2008: € 143 million).
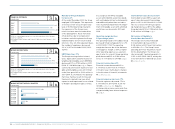
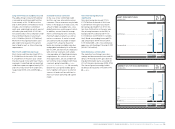
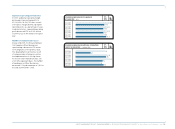
Euro dominates currency mix
The majority of our Group’s gross bor-
rowings are denominated in euros and US
dollars. At the end of 2009, gross borrow-
ings denominated in euros accounted for
61% of total gross borrowings (2008: 57%).
The share of gross borrowings held in
US dollars decreased to 33% (2008: 39%)
see 48.
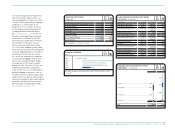
N
°-
48
CURRENCY SPLIT OF GROSS BORROWINGS
€ IN MILLIONS
2009 2008
Total 1,767 2,573
EUR .....................................................................1,076
1,004
1,470
4
95
USD ........................................................................591
All others ..................................................................97
JPY ............................................................................ 3
N
°-
47
SHORT-TERM CREDIT LINES
€ IN MILLIONS
2009 2008
Total 2,238 2,722
Committed .............................................................828
1,137
1,585
Uncommitted ......................................................1,410
GROUP MANAGEMENT REPORT – FINANCIAL REVIEW GROUP BUSINESS PERFORMANCE Treasury 129