Reebok 2009 Annual Report Download - page 121
Download and view the complete annual report
Please find page 121 of the 2009 Reebok annual report below. You can navigate through the pages in the report by either clicking on the pages listed below, or by using the keyword search tool below to find specific information within the annual report.-
 1
1 -
2
-
3
-
4
-
5
-
6
-
7
-
8
-
9
-
10
-
11
-
12
-
13
-
14
-
15
-
16
-
17
-
18
-
19
-
20
-
21
-
22
-
23
-
24
-
25
-
26
-
27
-
28
-
29
-
30
-
31
-
32
-
33
-
34
-
35
-
36
-
37
-
38
-
39
-
40
-
41
-
42
-
43
-
44
-
45
-
46
-
47
-
48
-
49
-
50
-
51
-
52
-
53
-
54
-
55
-
56
-
57
-
58
-
59
-
60
-
61
-
62
-
63
-
64
-
65
-
66
-
67
-
68
-
69
-
70
-
71
-
72
-
73
-
74
-
75
-
76
-
77
-
78
-
79
-
80
-
81
-
82
-
83
-
84
-
85
-
86
-
87
-
88
-
89
-
90
-
91
-
92
-
93
-
94
-
95
-
96
-
97
-
98
-
99
-
100
-
101
-
102
-
103
-
104
-
105
-
106
-
107
-
108
-
109
-
110
-
 111
111 -
 112
112 -
 113
113 -
 114
114 -
 115
115 -
 116
116 -
 117
117 -
 118
118 -
 119
119 -
 120
120 -
 121
121 -
 122
122 -
 123
123 -
 124
124 -
 125
125 -
 126
126 -
 127
127 -
 128
128 -
 129
129 -
 130
130 -
 131
131 -
132
-
133
-
134
-
135
-
136
-
137
-
138
-
139
-
140
-
141
-
142
-
143
-
144
-
145
-
146
-
147
-
148
-
149
-
150
-
151
-
152
-
153
-
154
-
155
-
156
-
157
-
158
-
159
-
160
-
161
-
162
-
163
-
164
-
165
-
166
-
167
-
168
-
169
-
170
-
171
-
172
-
173
-
174
-
175
-
176
-
177
-
178
-
179
-
180
-
181
-
182
-
183
-
184
-
185
-
186
-
187
-
188
-
189
-
190
-
191
-
192
-
193
-
194
-
195
-
196
-
197
-
198
-
199
-
200
-
201
-
202
-
203
-
204
-
205
-
206
-
207
-
208
-
209
-
210
-
211
-
212
-
213
-
214
-
215
-
216
-
217
-
218
-
219
-
220
-
221
-
222
-
223
-
224
-
225
-
226
-
227
-
228
-
229
-
230
-
231
-
232
-
233
-
234
 |
 |
GROUP MANAGEMENT REPORT – FINANCIAL REVIEW GROUP BUSINESS PERFORMANCE Income Statement 117
In European Emerging Markets, Group
sales decreased 7% on a currency-
neutral basis, primarily due to declines
in Russia as a result of the devaluation
of the Russian rouble against the func-
tional currency, the US dollar, which
could not be offset by price increases.
Sales for the adidas Group in North
America decreased 10% on a currency-
neutral basis due to declines in the USA
and Canada. Sales in Greater China
decreased 16% on a currency-neutral
basis. Revenues in Other Asian Markets
declined 3% primarily as a result of
decreases in Japan. In Latin America,
sales grew 19% on a currency-neutral
basis, with double-digit increases in most
of the region’s major markets, also sup-
ported by the consolidation of new com-
panies in the region see 11.
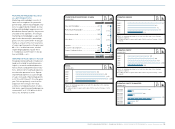
Currency translation effects had
a mixed impact on regional sales in
euro terms. Group revenues in Western
Europe decreased 8% to € 3.262 bil-
lion in 2009 from € 3.527 billion in
2008. In European Emerging Markets,
sales declined 5% to € 1.122 billion
in 2009 from € 1.179 billion in 2008.
Sales in North America decreased 6%
to € 2.360 billion from € 2.520 billion
in 2008. Revenues in Greater China
decreased 10% to € 967 million in 2009
from € 1.077 billion in 2008. In Other
Asian Markets, sales increased 4% to
€ 1.647 billion versus € 1.585 billion
in the prior year. Revenues in Latin
America grew 13% to € 1.006 billion from
€ 893 million in the prior year see 13.
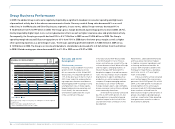
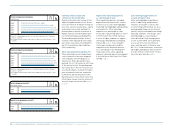
adidas Group revenues decline in all
product categories
In 2009, currency-neutral Group sales
declined in all product categories.
Currency-neutral footwear sales
decreased 7% during the period. This
development was due to declines
in Wholesale and Other Businesses
which more than offset an increase in
Retail. Apparel sales decreased 4% on
a currency-neutral basis. While sales
increased in Retail and Other Businesses,
revenues declined in Wholesale.
Currency-neutral hardware sales
decreased 6% compared to the prior year
due to declines in Wholesale, Retail and
Other Businesses.
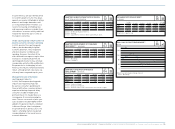
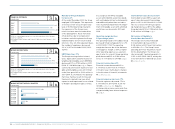
Currency translation effects
positively impacted sales in all prod-
uct categories in euro terms. Footwear
sales in euro terms decreased 6% to
€ 4.642 billion in 2009 (2008: € 4.919 bil-
lion). Apparel sales decreased 2% to
€ 4.663 billion in 2009 from € 4.775 bil-
lion in the prior year. Hardware sales
decreased 3% to € 1.076 billion in 2009
from € 1.105 billion in 2008 see 15.
Cost of sales increases
Cost of sales is defined as the amount we
pay to third parties for expenses associ-
ated with producing and delivering our
products. Own-production expenses are
also included in the Group’s cost of sales.
However, these expenses represent only
a very small portion of total cost of sales.
In 2009, cost of sales was € 5.669 billion,
representing an increase of 2% compared
to € 5.543 billion in 2008. This develop-
ment was due to significant increases
of raw material and labour costs which
more than offset positive effects from the
optimisation of sourcing processes and
efficiency gains within our supply chain.
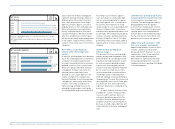
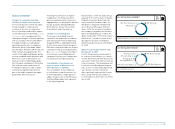
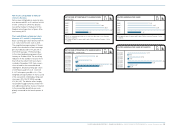
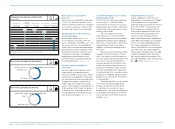
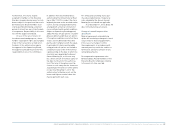
Gross margin negatively impacted
by higher input costs
The gross margin of the adidas Group
decreased 3.3 percentage points to 45.4%
in 2009 (2008: 48.7%) see 16. This
development was mainly due to higher
input costs, currency devaluation effects
as well as higher clearance sales and
promotional activity. Currency devalu-
ation effects were mainly related to
Russia. In this market, sales were nega-
tively impacted by the devaluation of the
Russian rouble against the functional
currency, the US dollar, whereas cost
of goods sold remained largely unaffec-
ted. The vast majority of these costs are
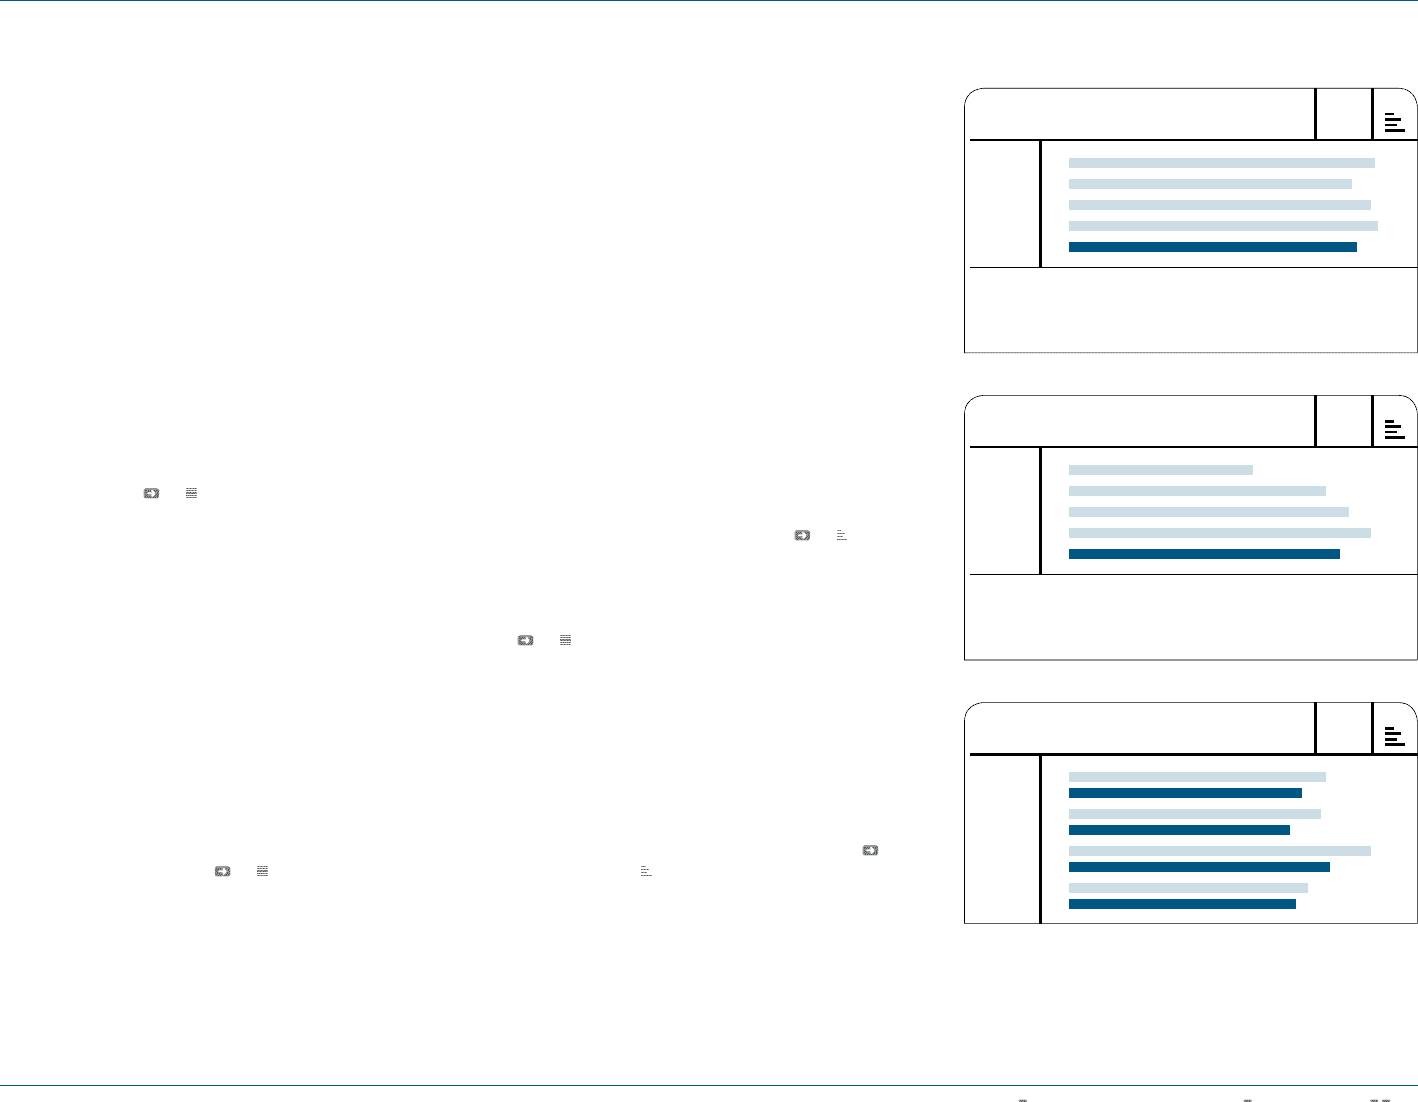
denominated in US dollars. As a result,
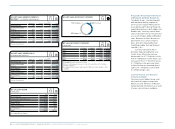
gross profit for the adidas Group declined
10% in 2009 to € 4.712 billion versus
€ 5.256 billion in the prior year see
17.
N
°-
1 6
N
°-
1 7
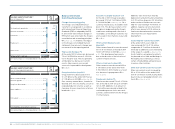
GROSS MARGIN
IN %
GROSS PROFIT
€ IN MILLIONS
2005 1 )
2006 2 )
2007
2008
2009
2005 1 )
2006 2 )
2007
2008
2009
48.2
44.6
47.4
48.7
45.4
3,197
4,495
4,882
5,256
4,712
1) Reflects continuing operations as a result of the divestiture of the Salomon
business segment.
2) Including Reebok, Rockport and Reebok-CCM Hockey from February 1, 2006
onwards.
1) Reflects continuing operations as a result of the divestiture of the Salomon
business segment.
2) Including Reebok, Rockport and Reebok-CCM Hockey from February 1, 2006
onwards.
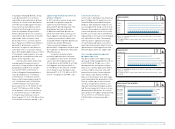
N
°-
1 8
GROSS PROFIT BY QUARTER
€ IN MILLIONS
Q1 2008
Q1 2009
Q2 2008
Q2 2009
Q3 2008
Q3 2009
Q4 2008
Q4 2009
1,288
1,164
1,263
1,105
1,511
1,307
1,194
1,136