Reebok 2009 Annual Report Download - page 117
Download and view the complete annual report
Please find page 117 of the 2009 Reebok annual report below. You can navigate through the pages in the report by either clicking on the pages listed below, or by using the keyword search tool below to find specific information within the annual report.-
 1
1 -
2
-
3
-
4
-
5
-
6
-
7
-
8
-
9
-
10
-
11
-
12
-
13
-
14
-
15
-
16
-
17
-
18
-
19
-
20
-
21
-
22
-
23
-
24
-
25
-
26
-
27
-
28
-
29
-
30
-
31
-
32
-
33
-
34
-
35
-
36
-
37
-
38
-
39
-
40
-
41
-
42
-
43
-
44
-
45
-
46
-
47
-
48
-
49
-
50
-
51
-
52
-
53
-
54
-
55
-
56
-
57
-
58
-
59
-
60
-
61
-
62
-
63
-
64
-
65
-
66
-
67
-
68
-
69
-
70
-
71
-
72
-
73
-
74
-
75
-
76
-
77
-
78
-
79
-
80
-
81
-
82
-
83
-
84
-
85
-
86
-
87
-
88
-
89
-
90
-
91
-
92
-
93
-
94
-
95
-
96
-
97
-
98
-
99
-
100
-
101
-
102
-
103
-
104
-
105
-
106
-
 107
107 -
 108
108 -
 109
109 -
 110
110 -
 111
111 -
 112
112 -
 113
113 -
 114
114 -
 115
115 -
 116
116 -
 117
117 -
 118
118 -
 119
119 -
 120
120 -
 121
121 -
 122
122 -
 123
123 -
 124
124 -
 125
125 -
 126
126 -
 127
127 -
128
-
129
-
130
-
131
-
132
-
133
-
134
-
135
-
136
-
137
-
138
-
139
-
140
-
141
-
142
-
143
-
144
-
145
-
146
-
147
-
148
-
149
-
150
-
151
-
152
-
153
-
154
-
155
-
156
-
157
-
158
-
159
-
160
-
161
-
162
-
163
-
164
-
165
-
166
-
167
-
168
-
169
-
170
-
171
-
172
-
173
-
174
-
175
-
176
-
177
-
178
-
179
-
180
-
181
-
182
-
183
-
184
-
185
-
186
-
187
-
188
-
189
-
190
-
191
-
192
-
193
-
194
-
195
-
196
-
197
-
198
-
199
-
200
-
201
-
202
-
203
-
204
-
205
-
206
-
207
-
208
-
209
-
210
-
211
-
212
-
213
-
214
-
215
-
216
-
217
-
218
-
219
-
220
-
221
-
222
-
223
-
224
-
225
-
226
-
227
-
228
-
229
-
230
-
231
-
232
-
233
-
234
 |
 |
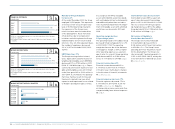
GROUP MANAGEMENT REPORT – FINANCIAL REVIEW GROUP BUSINESS PERFORMANCE Economic and Sector Development 113
N
°-
02
N
°-
03
N
°-
04
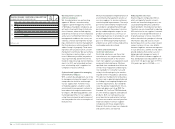
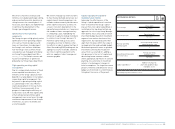
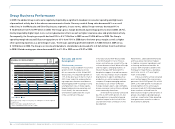
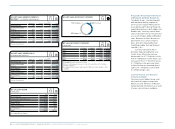
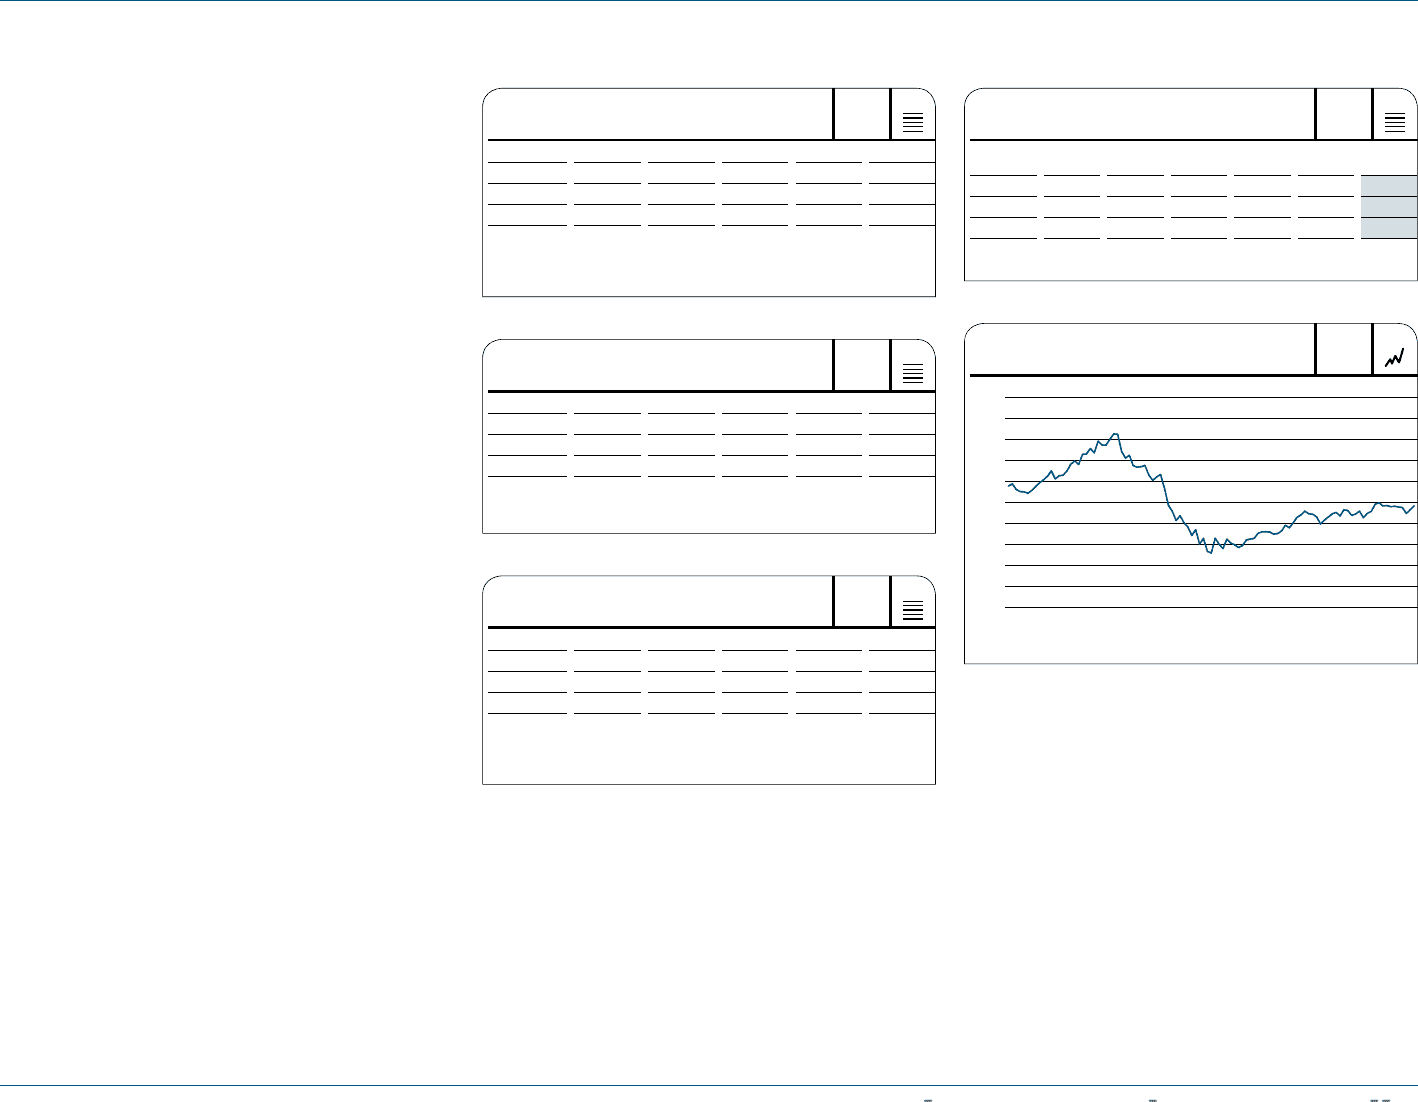
QUARTERLY UNEMPLOYMENT RATE BY REGION
IN % OF TOTAL ACTIVE POPULATION
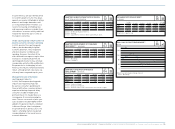
QUARTERLY DEVELOPMENT OF CONSUMER
PRICE INDEX 1) 2) BY REGION
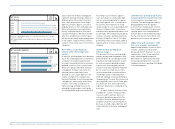
QUARTERLY CONSUMER CONFIDENCE
DEVELOPMENT BY REGION
Q4 2008 Q1 2009 Q2 2009 Q3 2009 Q4 2009
USA 1 ) 7.4 8.6 9.5 9.8 10.0
Euro Zone 2 ) 8.2 9.1 9.4 9.8 10.0
Japan 3 ) 4.3 4.8 5.4 5.3 5.1
1) Source: US Bureau of Labour Statistics.
2) Source: Eurostat.
3) Source: Japan Ministry of Internal Affairs and Communications.
Q4 2008 Q1 2009 Q2 2009 Q3 2009 Q4 2009
USA 0.1 (0.4) (1.4) (1.3) 2.7
Euro Zone 1.6 0.6 (0.1) (0.3) 0.9
Japan 0.4 (0.3) (1.8) (2.2) (1.7)
1) Source: Bloomberg.
2) Quarter-end figures.
Q4 2008 Q1 2009 Q2 2009 Q3 2009 Q4 2009
USA 1 ) 38.6 26.9 49.3 53.4 53.6
Euro Zone 2 ) (31) (34) (25) (16) (19)
Japan 3 ) 26.7 29.6 38.1 40.7 37.9
1) Source: Conference Board.
2) Source: European Commission.
3) Source: Economic and Social Research Institute, Government of Japan.
N
°-
05
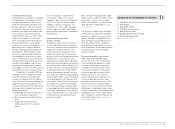
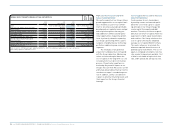
EXCHANGE RATE DEVELOPMENT 1 )
€ 1 EQUALS
Average
rate 2008 Q1 2009 Q2 2009 Q3 2009 Q4 2009 Average
rate 2009
USD 1.4702 1.3308 1.4134 1.4643 1.4406 1.3932
GBP 0.7956 0.9308 0.8521 0.9093 0.8881 0.8912
JPY 152.39 131.17 135.51 131.07 133.16 130.23
1) Spot rates at quarter-end.
N
°-
06
2008 – 2009 OIL PRICE DEVELOPMENT 1 )
IN US $
Jan. 1, 2008 Dec. 31, 2009
160
120
80
40
0
1) West Texas Intermediate Cushing crude oil.
Source: Bloomberg.
In Latin America, full year GDP declined
3.6% (2008: growth of 3.2%). This devel-
opment was mainly attributable to falling
domestic and foreign demand as well
as rising unemployment. However, as a
result of increasing commodity prices
and improving conditions in global finan-
cial markets, economic activity stabilised
towards the end of the year in some of
the region’s economies.
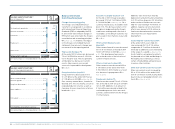
Global sporting goods industry affected
by price-sensitive consumer spending
In 2009, growth of the sporting goods
industry was burdened by the global
economic downturn, which negatively
affected consumer confidence and
spending. However, the extent of the
effect differed from region to region. After
many years of significant growth, the
sporting goods market in Asia softened
considerably, while the USA and Western
Europe were also challenging. In Latin
America, the industry remained relatively
robust, although growth rates were sig-
nificantly lower compared to prior years.
Weak performance of European
sporting goods industry
In 2009, the European sporting goods
industry was negatively impacted
by cautious consumer spending and
financial difficulties some key retailers
experienced during the period. Many
consumers traded off higher price
point purchases for cheaper buys as a
consequence of increasing unemploy-
ment. The non-recurrence of prior year
sales related to the UEFA EURO 2008™
added to the general industry slowdown
in Western Europe. After having been
the growth driver in previous years, the
region’s emerging markets weakened
considerably due to the overall macro-
economic downturn.