Reebok 2009 Annual Report Download - page 207
Download and view the complete annual report
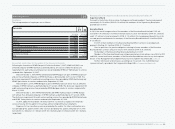
Please find page 207 of the 2009 Reebok annual report below. You can navigate through the pages in the report by either clicking on the pages listed below, or by using the keyword search tool below to find specific information within the annual report.-
 1
1 -
2
-
3
-
4
-
5
-
6
-
7
-
8
-
9
-
10
-
11
-
12
-
13
-
14
-
15
-
16
-
17
-
18
-
19
-
20
-
21
-
22
-
23
-
24
-
25
-
26
-
27
-
28
-
29
-
30
-
31
-
32
-
33
-
34
-
35
-
36
-
37
-
38
-
39
-
40
-
41
-
42
-
43
-
44
-
45
-
46
-
47
-
48
-
49
-
50
-
51
-
52
-
53
-
54
-
55
-
56
-
57
-
58
-
59
-
60
-
61
-
62
-
63
-
64
-
65
-
66
-
67
-
68
-
69
-
70
-
71
-
72
-
73
-
74
-
75
-
76
-
77
-
78
-
79
-
80
-
81
-
82
-
83
-
84
-
85
-
86
-
87
-
88
-
89
-
90
-
91
-
92
-
93
-
94
-
95
-
96
-
97
-
98
-
99
-
100
-
101
-
102
-
103
-
104
-
105
-
106
-
107
-
108
-
109
-
110
-
111
-
112
-
113
-
114
-
115
-
116
-
117
-
118
-
119
-
120
-
121
-
122
-
123
-
124
-
125
-
126
-
127
-
128
-
129
-
130
-
131
-
132
-
133
-
134
-
135
-
136
-
137
-
138
-
139
-
140
-
141
-
142
-
143
-
144
-
145
-
146
-
147
-
148
-
149
-
150
-
151
-
152
-
153
-
154
-
155
-
156
-
157
-
158
-
159
-
160
-
161
-
162
-
163
-
164
-
165
-
166
-
167
-
168
-
169
-
170
-
171
-
172
-
173
-
174
-
175
-
176
-
177
-
178
-
179
-
180
-
181
-
182
-
183
-
184
-
185
-
186
-
187
-
188
-
189
-
190
-
191
-
192
-
193
-
194
-
195
-
196
-
 197
197 -
 198
198 -
 199
199 -
 200
200 -
 201
201 -
 202
202 -
 203
203 -
 204
204 -
 205
205 -
 206
206 -
 207
207 -
 208
208 -
 209
209 -
 210
210 -
 211
211 -
 212
212 -
 213
213 -
 214
214 -
 215
215 -
 216
216 -
 217
217 -
218
-
219
-
220
-
221
-
222
-
223
-
224
-
225
-
226
-
227
-
228
-
229
-
230
-
231
-
232
-
233
-
234
 |
 |

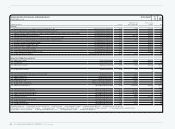
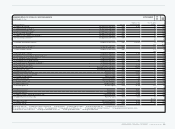
CONSOLIDATED FINANCIAL STATEMENTS Notes 203
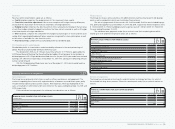
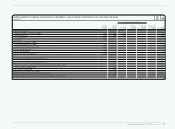
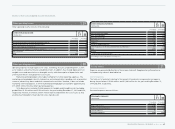
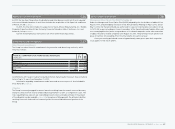
The movements of deferred taxes are as follows:
N
°-
33
MOVEMENT OF DEFERRED TAXES
€ IN MILLIONS
2009 2008
Deferred tax assets, net as at January 1 (119) (135)
Deferred tax income 43 71
Change in consolidated companies ( see Note 4) 1 ) — (9)
Change in deferred taxes on assets classified as held-for-sale ( see Note 3) 2 ) (3) 3
Change in deferred taxes attributable to effective portion of qualifying hedging
instruments recorded in equity( see Note 28) 46 (41)
Currency translation differences 6 (5)
Change in deferred taxes attributable to actuarial gains and losses recorded
in equity ( see Note 23) 6 (3)
Deferred tax assets, net as at December 31 (21) (119)
1) Relates to the acquisition of Ashworth, Inc. and Textronics, Inc. for the year ending December 31, 2008.
2) Relates to the disposal group Gekko Brands, LLC which was classified as Held-for-Sale for the year ending
December 31, 2008 and sold in March 2009.
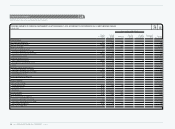
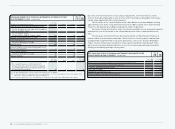
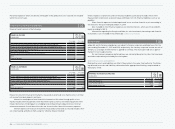
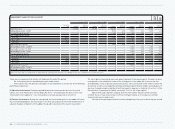
Gross Group deferred tax assets and liabilities before valuation allowances and appropriate
offsettings are attributable to the items detailed in the table below:
N
°-
33
DEFERRED TAXES
€ IN MILLIONS
Dec. 31, 2009 Dec. 31, 2008
Non-current assets 129 88
Current assets 87 100
Accrued liabilities and provisions 132 140
Accumulated tax loss carry-forwards 78 91
Deferred tax assets 426 419
Non-current assets 420 444
Current assets 25 45
Accrued liabilities and provisions 2 49
Deferred tax liabilities 447 538
Deferred tax assets, net (21) (119)
Deferred tax assets are recognised only to the extent that the realisation of the related benefit is
probable. For the assessment of probability, in addition to past performance and the respective
prospects for the foreseeable future, appropriate tax structuring measures are also taken into
consideration.
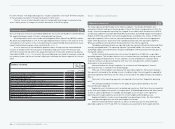
Deferred tax assets for which the realisation of the related tax benefits is not probable increased
on a currency-neutral basis, and after taking into account the resolution of foreign tax disputes
from € 212 million to € 297 million for the year ending December 31, 2009. These amounts
mainly relate to tax losses carried forward and unused foreign tax credits of the US tax group.
The remaining unrecognised deferred tax assets relate to companies operating in markets
where the realisation of the related tax benefit is not considered probable.
The Group does not recognise deferred tax liabilities for unremitted earnings of non- German
subsidiaries to the extent that they are expected to be permanently invested in international
operations. These earnings, the amount of which cannot be practicably computed, could become
subject to additional tax if they were remitted as dividends or if the Group were to sell its share-
holdings in the subsidiaries.
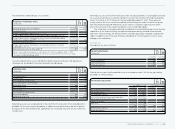
Tax expenses Tax expenses
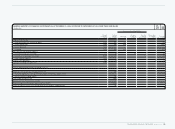
Tax expenses are split as follows:
N
°-
33
INCOME TAX EXPENSES
€ IN MILLIONS
Year ending
Dec. 31, 2009 Year ending
Dec. 31, 2008
Current tax expenses 156 331
Deferred tax (income) (43) (71)
Income tax expenses 113 260
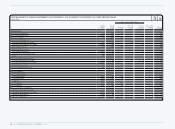
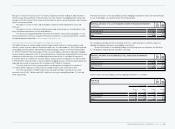
The effective tax rate of the Group differs from an assumed tax rate of 30% for the year ending
December 31, 2009 as follows:
N
°-
33
TAX RATE RECONCILIATION
Year ending Dec. 31, 2009 Year ending Dec. 31, 2008
€ in millions in % € in millions in %
Expected income tax expenses 108 30.0 271 30.0
Tax rate differentials (94) (26.1) (72) (7.9)
Non-deductible expenses (36) (10.1) 45 4.9
Losses for which benefits were not recognisable
and changes in valuation allowances 119 33.2 2 0.2
Changes in tax rates 4 1.1 10.1
Other, net 1 0.3 1 0.1
102 28.3 248 27.4
Withholding tax expenses 11 3.1 12 1.4
Income tax expenses 113 31.5 260 28.8