Reebok 2009 Annual Report Download - page 114
Download and view the complete annual report
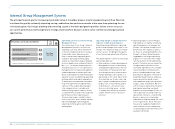
Please find page 114 of the 2009 Reebok annual report below. You can navigate through the pages in the report by either clicking on the pages listed below, or by using the keyword search tool below to find specific information within the annual report.-
 1
1 -
2
-
3
-
4
-
5
-
6
-
7
-
8
-
9
-
10
-
11
-
12
-
13
-
14
-
15
-
16
-
17
-
18
-
19
-
20
-
21
-
22
-
23
-
24
-
25
-
26
-
27
-
28
-
29
-
30
-
31
-
32
-
33
-
34
-
35
-
36
-
37
-
38
-
39
-
40
-
41
-
42
-
43
-
44
-
45
-
46
-
47
-
48
-
49
-
50
-
51
-
52
-
53
-
54
-
55
-
56
-
57
-
58
-
59
-
60
-
61
-
62
-
63
-
64
-
65
-
66
-
67
-
68
-
69
-
70
-
71
-
72
-
73
-
74
-
75
-
76
-
77
-
78
-
79
-
80
-
81
-
82
-
83
-
84
-
85
-
86
-
87
-
88
-
89
-
90
-
91
-
92
-
93
-
94
-
95
-
96
-
97
-
98
-
99
-
100
-
101
-
102
-
103
-
 104
104 -
 105
105 -
 106
106 -
 107
107 -
 108
108 -
 109
109 -
 110
110 -
 111
111 -
 112
112 -
 113
113 -
 114
114 -
 115
115 -
 116
116 -
 117
117 -
 118
118 -
 119
119 -
 120
120 -
 121
121 -
 122
122 -
 123
123 -
 124
124 -
125
-
126
-
127
-
128
-
129
-
130
-
131
-
132
-
133
-
134
-
135
-
136
-
137
-
138
-
139
-
140
-
141
-
142
-
143
-
144
-
145
-
146
-
147
-
148
-
149
-
150
-
151
-
152
-
153
-
154
-
155
-
156
-
157
-
158
-
159
-
160
-
161
-
162
-
163
-
164
-
165
-
166
-
167
-
168
-
169
-
170
-
171
-
172
-
173
-
174
-
175
-
176
-
177
-
178
-
179
-
180
-
181
-
182
-
183
-
184
-
185
-
186
-
187
-
188
-
189
-
190
-
191
-
192
-
193
-
194
-
195
-
196
-
197
-
198
-
199
-
200
-
201
-
202
-
203
-
204
-
205
-
206
-
207
-
208
-
209
-
210
-
211
-
212
-
213
-
214
-
215
-
216
-
217
-
218
-
219
-
220
-
221
-
222
-
223
-
224
-
225
-
226
-
227
-
228
-
229
-
230
-
231
-
232
-
233
-
234
 |
 |
110 GROUP MANAGEMENT REPORT – FINANCIAL REVIEW Internal Group Management System
M&A activities focus on long-term
value creation potential
We see the majority of our Group’s future
growth opportunities in our organic busi-
ness. However, as part of our commit-
ment to ensuring sustainable profitable
development we regularly review merger
and acquisition options that may pro-
vide additional commercial and opera-
tional opportunities. Acquisitive growth
focus is primarily related to improving
our Group’s positioning within a sports
category, strengthening our technology
portfolio or addressing new consumer
segments.
The strategies of any potential
acquisition candidate must correspond
with the Group’s direc
tion. Maximising
return on invested capital above the
cost of capital in the
long term is a core
consideration in our decision-making
process. Of particular importance is
evaluating the potential impact on our
Group’s free cash flow. We assess current
and future projected key financial metrics
to evaluate a target’s contribution poten-
tial. In addition, careful consideration
is given to potential financing needs and
their impact on the Group’s financial
leverage.
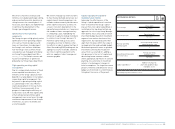
Cost of capital metric used to measure
investment potential
Creating value for our shareholders
by earning a return on invested capital
above the cost of that capital is a guid-
ing principle of our Group strategy. We
source capital from equity and debt
markets. Therefore, we have a responsi-
bility that our return on capital meets the
expectations of both equity shareholders
and creditors. Our Group calculates the
cost of capital utilising the weighted
average cost of capital (WACC) formula.
This metric allows us to calculate the
minimum required financial returns of
planned capital investments. The cost of
equity is computed utilising the risk-free
rate, market risk premium and beta. Cost
of debt is calculated using the risk-free
rate, credit spread and average tax rate.
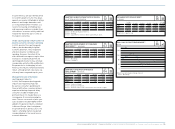
N
°-
03
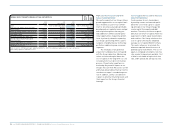
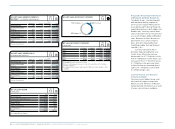
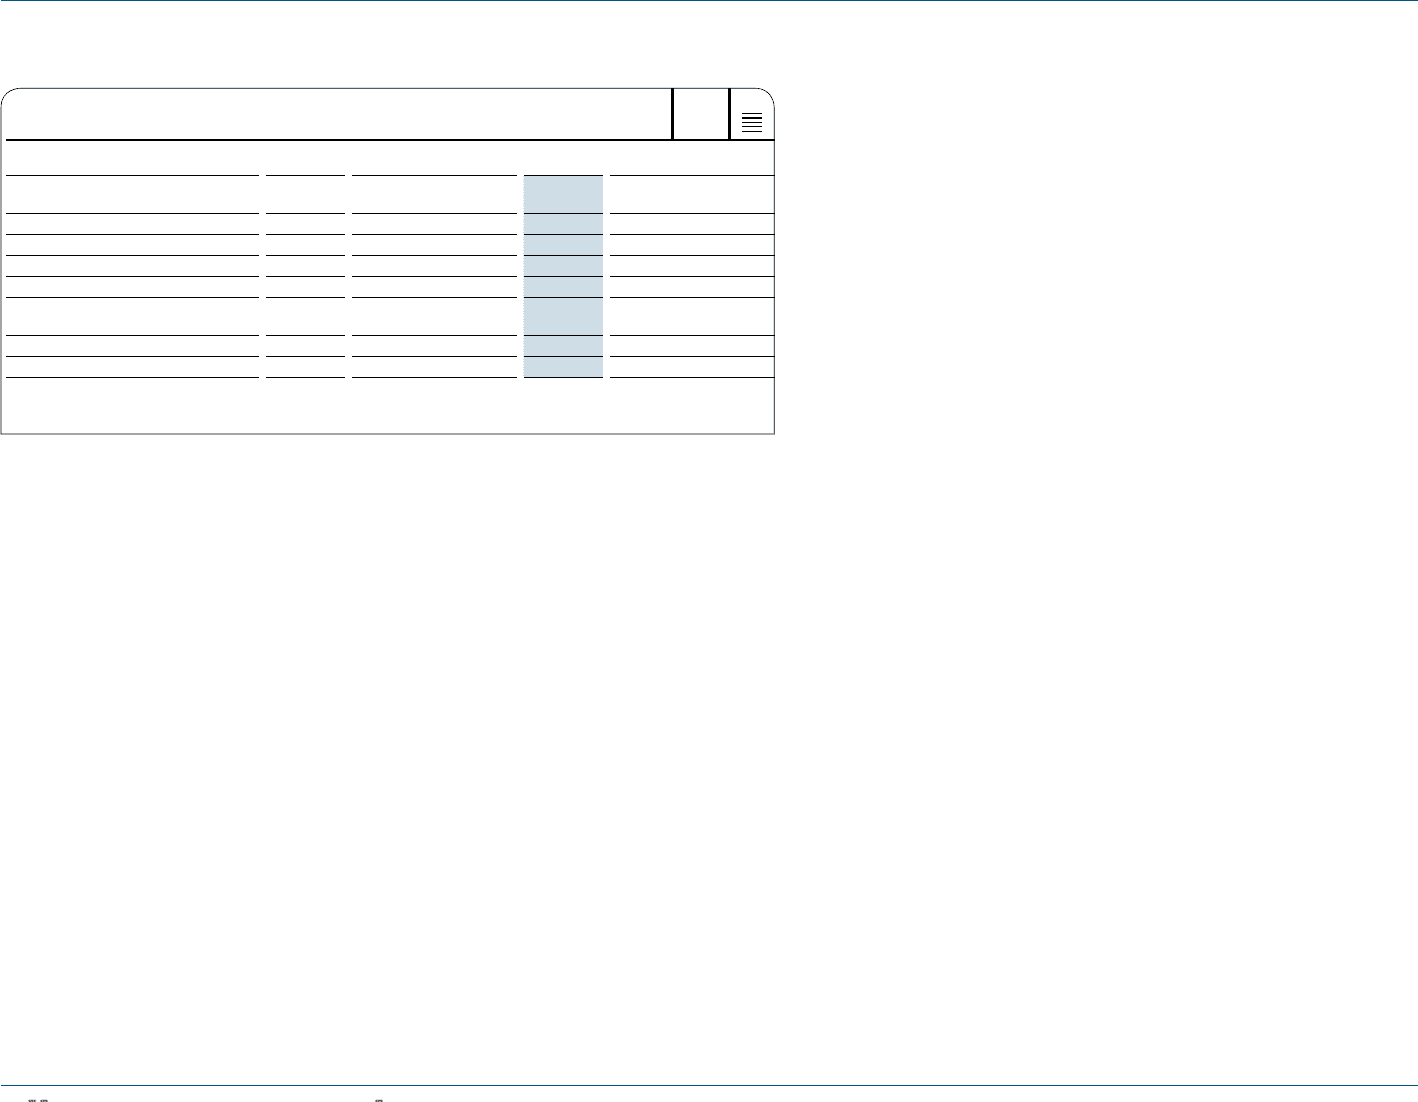
ADIDAS GROUP TARGETS VERSUS ACTUAL KEY METRICS
2008
Actual 2009
Initial outlook 1 )
2009
Actual 2010
Targets
Sales
(year-over-year change, currency-neutral)
9% low- to mid-single-digit
decline (6%) low- to mid-single-digit
increase
Gross margin 48.7% decline 45.4% 46 – 47%
Other operating expenses (in % of sales) 40.5% increase 42.3% moderate decline
Operating margin 9.9% decline 4.9% around 6.5%
(Diluted) earnings per share (in €) 3.07 decline 1.22 1.90 to 2.15
Average operating working capital
(in % of net sales)
24.5% further reduction 24.3% further reduction
Capital expenditure (€ in millions) 2 ) 380 300 – 400 240 300 – 400
Net debt (€ in millions) 2,189 reduction 917 further reduction
1) As stated in the 2008 Annual Report, published on March 4, 2009. The outlook was updated over the course of the year.
2) Excluding acquisitions and finance leases.