Reebok 2009 Annual Report Download - page 116
Download and view the complete annual report
Please find page 116 of the 2009 Reebok annual report below. You can navigate through the pages in the report by either clicking on the pages listed below, or by using the keyword search tool below to find specific information within the annual report.
112 GROUP MANAGEMENT REPORT – FINANCIAL REVIEW GROUP BUSINESS PERFORMANCE Economic and Sector Development
Group Business Performance
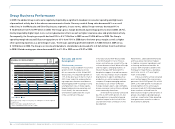
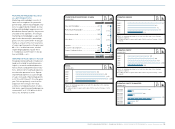
In 2009, the adidas Group results were negatively impacted by a significant slowdown in consumer spending and high levels
of promotional activity due to the adverse macroeconomic climate. Currency-neutral Group sales decreased 6% as a result
of declines in the Wholesale and Other Businesses segments. In euro terms, adidas Group revenues decreased 4% to
€ 10.381 billion from € 10.799 billion in 2008. The Group’s gross margin declined 3.3 percentage points to 45.4% (2008: 48.7%),
mainly impacted by higher input costs, currency devaluation effects as well as higher clearance sales and promotional activity.
Consequently, the Group’s gross profit declined 10% to € 4.712 billion in 2009 versus € 5.256 billion in 2008. The Group’s
operating margin decreased 5.0 percentage points to 4.9% from 9.9% in 2008 due to the lower gross margin as well as higher
other operating expenses as a percentage of sales. The Group’s operating profit declined 53% to € 508 million in 2009 versus
€ 1.070 billion in 2008. The Group’s net income attributable to shareholders decreased 62% to € 245 million from € 642 million
in 2008. Diluted earnings per share decreased 60% to € 1.22 in 2009 versus € 3.07 in 2008.
Economic and Sector
Development
Global economy contracts
Following a sharp slowdown in economic
growth in 2008, the global economy
fell into recession in 2009. Global GDP
decreased 2.2% compared to growth of
1.7% in the prior year. In the first half of
2009, lower industrial and manufactur-
ing output was the main contributor to
declining global GDP resulting in rising
unemployment rates in many regions.
Supported by extensive monetary and
fiscal stimuli, the macroeconomic
environment stabilised in the course
of the second half of the year.
N
°-
01
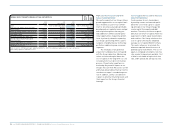
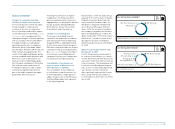
REGIONAL GDP DEVELOPMENT 1 )
IN %
Global Europe USA Asia 2 ) Latin America
6
4
2
0
(2)
(4)
2007 2008 2009
1) Real, percentage change versus prior year; 2008 figures restated compared
to prior year.
2) Asia also includes Japan and Area Pacific.
Source: World Bank, HSBC, Barclay’s Capital.
In Europe, full year GDP decreased by
4.2% (2008: growth of 1.4%). The eco-
nomic contraction was a result of the sig-
nificant downturn in both Western Europe
and the region’s emerging markets. In
Western Europe, GDP declined 3.9%
despite the support of record low interest
rates. This was mainly a result of double-
digit declines in exports and industrial
production, as well as weak private con-
sumption. European emerging markets
declined at a rate similar to Western
Europe, however export- and commodity-
driven economies such as Russia suffered
more extensively than others.
In the USA, the economy contracted
by 2.5% in 2009 (2008: growth of 0.4%).
Strong declines in manufacturing and
industrial output in the first half of the
year were the main contributors to this
development.
Nevertheless, unprecedented monetary
and fiscal policy intervention helped
to stabilise consumer spending as well
as housing and financial markets. As
a result, GDP returned to growth in the
third quarter. Nevertheless, unemploy-
ment rates rose to a 17-year high of
10.5% in December.
In Asia, economic activity remained
most resilient against the recessionary
pressures. Asia’s GDP grew 0.5% in 2009
(2008: 2.9%). GDP growth in China decel-
erated slightly to 8.5%, while Japan’s
economy shrank 5.2%. While developed
Asian countries suffered from the
deter ioration of exports and low levels of
private consumption, developing Asian
countries, in particular China, benefited
from government stimulus in order to
boost domestic demand.


