Reebok 2009 Annual Report Download - page 203
Download and view the complete annual report
Please find page 203 of the 2009 Reebok annual report below. You can navigate through the pages in the report by either clicking on the pages listed below, or by using the keyword search tool below to find specific information within the annual report.-
 1
1 -
2
-
3
-
4
-
5
-
6
-
7
-
8
-
9
-
10
-
11
-
12
-
13
-
14
-
15
-
16
-
17
-
18
-
19
-
20
-
21
-
22
-
23
-
24
-
25
-
26
-
27
-
28
-
29
-
30
-
31
-
32
-
33
-
34
-
35
-
36
-
37
-
38
-
39
-
40
-
41
-
42
-
43
-
44
-
45
-
46
-
47
-
48
-
49
-
50
-
51
-
52
-
53
-
54
-
55
-
56
-
57
-
58
-
59
-
60
-
61
-
62
-
63
-
64
-
65
-
66
-
67
-
68
-
69
-
70
-
71
-
72
-
73
-
74
-
75
-
76
-
77
-
78
-
79
-
80
-
81
-
82
-
83
-
84
-
85
-
86
-
87
-
88
-
89
-
90
-
91
-
92
-
93
-
94
-
95
-
96
-
97
-
98
-
99
-
100
-
101
-
102
-
103
-
104
-
105
-
106
-
107
-
108
-
109
-
110
-
111
-
112
-
113
-
114
-
115
-
116
-
117
-
118
-
119
-
120
-
121
-
122
-
123
-
124
-
125
-
126
-
127
-
128
-
129
-
130
-
131
-
132
-
133
-
134
-
135
-
136
-
137
-
138
-
139
-
140
-
141
-
142
-
143
-
144
-
145
-
146
-
147
-
148
-
149
-
150
-
151
-
152
-
153
-
154
-
155
-
156
-
157
-
158
-
159
-
160
-
161
-
162
-
163
-
164
-
165
-
166
-
167
-
168
-
169
-
170
-
171
-
172
-
173
-
174
-
175
-
176
-
177
-
178
-
179
-
180
-
181
-
182
-
183
-
184
-
185
-
186
-
187
-
188
-
189
-
190
-
191
-
192
-
 193
193 -
 194
194 -
 195
195 -
 196
196 -
 197
197 -
 198
198 -
 199
199 -
 200
200 -
 201
201 -
 202
202 -
 203
203 -
 204
204 -
 205
205 -
 206
206 -
 207
207 -
 208
208 -
 209
209 -
 210
210 -
 211
211 -
 212
212 -
 213
213 -
214
-
215
-
216
-
217
-
218
-
219
-
220
-
221
-
222
-
223
-
224
-
225
-
226
-
227
-
228
-
229
-
230
-
231
-
232
-
233
-
234
 |
 |
CONSOLIDATED FINANCIAL STATEMENTS Notes 199
Net gains or losses on financial assets or financial liabilities held for trading include the effects
from fair value measurements of the derivatives that are not part of a hedging relationship, and
changes in the fair value of other financial instruments as well as interest payments which mainly
relate to investment funds.
Net gains or losses on loans and receivables comprise mainly impairment losses and
reversals.
Net gains or losses on financial liabilities measured at amortised cost include effects from
early settlement and reversals of accrued liabilities.
The disclosures required by IFRS 7 Financial Instruments: Disclosures paragraphs 31 – 42
(“Nature and Extent of Risks arising from Financial Instruments”) can be found in Note 7 and the
Group Management Report see Risk and Opportunity Report, p. 140.
Financial instruments for the hedging of foreign exchange riskFinancial instruments for the hedging of foreign exchange risk
The adidas Group uses natural hedges and arranges forward contracts, currency options and
currency swaps to protect against foreign exchange risk. As of December 31, 2009, the Group had
outstanding currency options with premiums paid totalling an amount of € 6 million (December
31, 2008: € 5 million). The effective part of the currency hedges is directly recognised in hedging
reserves and the acquisition costs of secured inventories, respectively, and posted into the income
statement at the same time as the underlying secured transaction is recorded. An amount of
€ 4 million (2008: € 9 million) for currency options and an amount of negative € 41 million (2008:
€ 85 million) for forward contracts were recorded in hedging reserves. Currency option premiums
impacted net income in the amount of € 4 million in 2009 (2008: € 6 million).
The total time value of the currency options not being part of a hedge in an amount of
€ 3 million (2008: negative € 2 million) was recorded in the income statement in 2009.
The total net amount of US dollar purchases related to product sourcing versus other
currencies was US $ 3.7 billion and US $ 3.6 billion in the years ending December 31, 2009 and
2008, respectively.
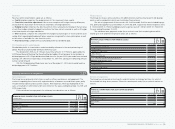
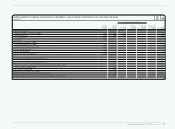
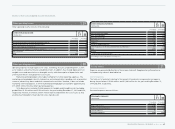
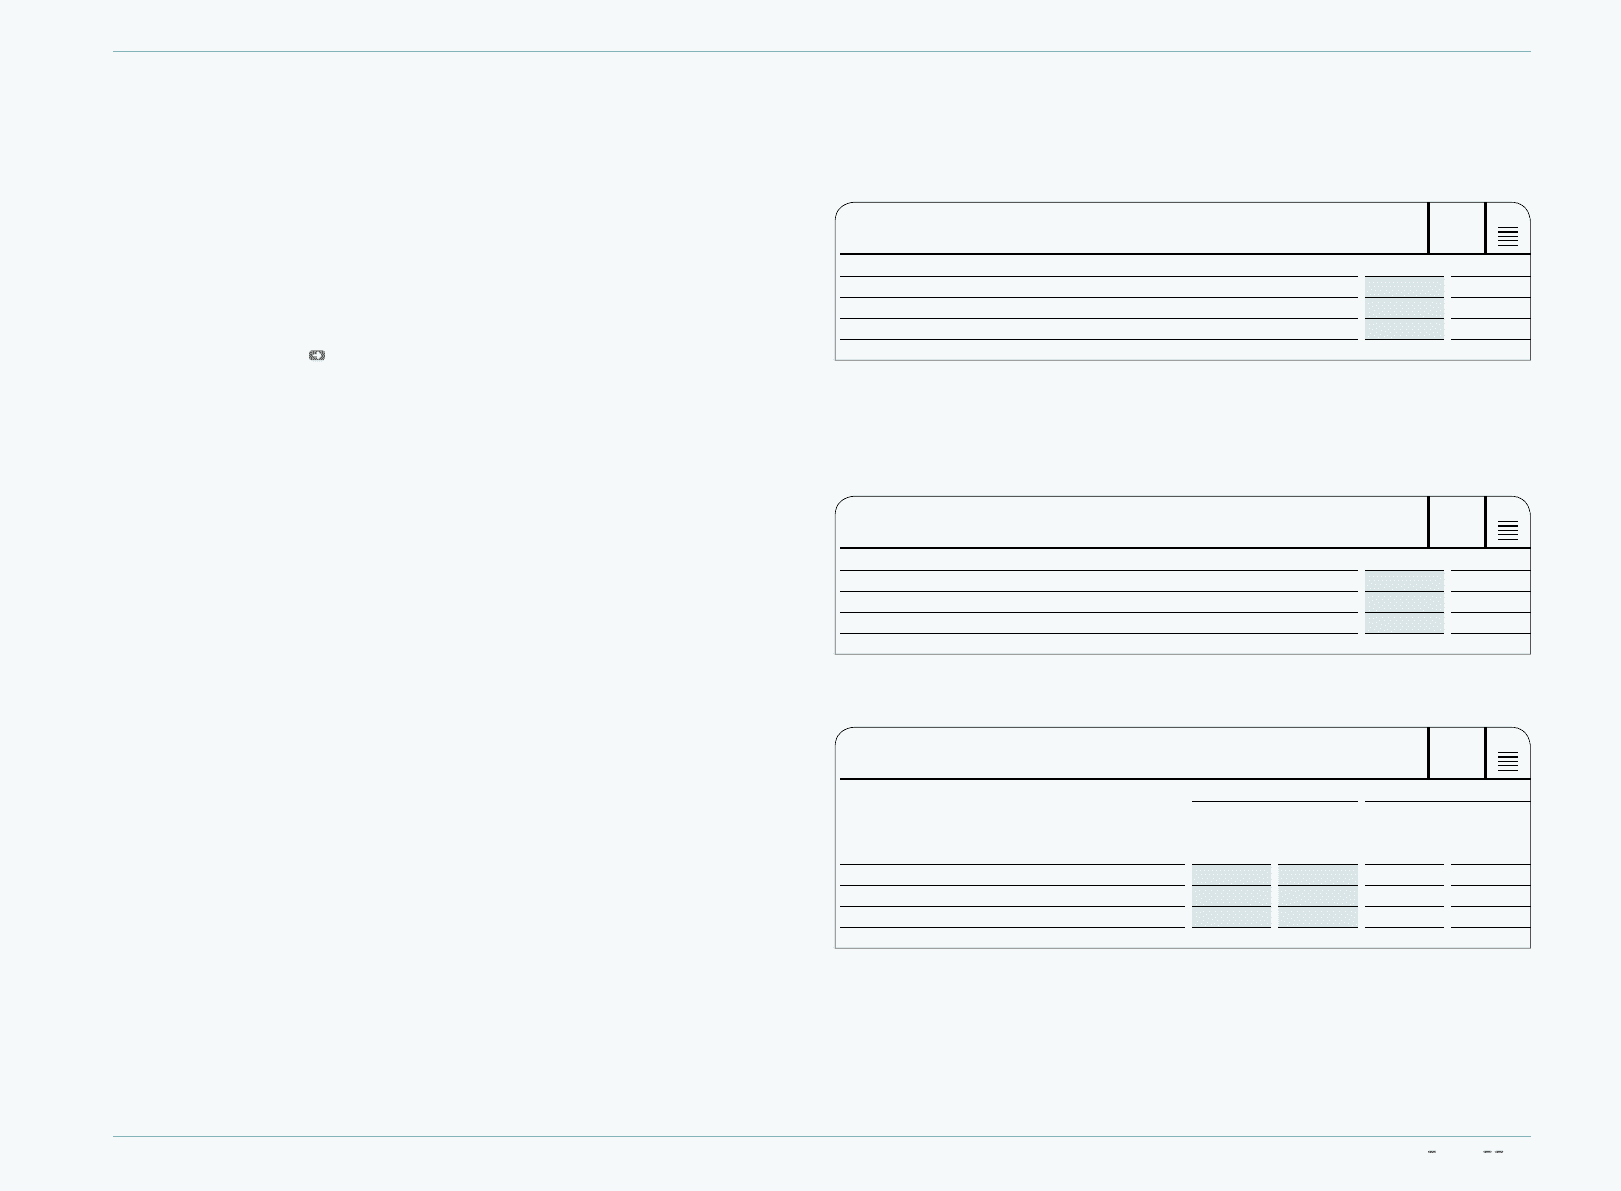
The notional amounts of all outstanding currency hedging instruments, which are mainly related
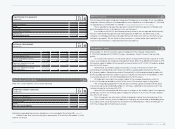
to cash flow hedges, are summarised in the following table:
N
°-
28
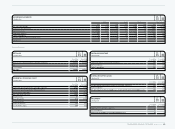
NOTIONAL AMOUNTS OF ALL OUTSTANDING CURRENCY HEDGING INSTRUMENTS
€ IN MILLIONS
Dec. 31, 2009 Dec. 31, 2008
Forward contracts 3,118 2,904
Currency options 532 487
Total 3,650 3,391
The comparatively high amount of forward contracts is primarily due to currency swaps for
liquidity management purposes and hedging transactions.
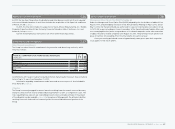
Of the total amount of outstanding hedges, the following contracts related to the US dollar
(i.e. the biggest single exposure of product sourcing):
N
°-
28
NOTIONAL AMOUNTS OF OUTSTANDING US DOLLAR HEDGING INSTRUMENTS
€ IN MILLIONS
Dec. 31, 2009 Dec. 31, 2008
Forward contracts 2,252 1,732
Currency options 532 457
Total 2,784 2,189
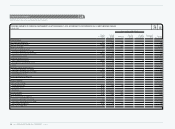
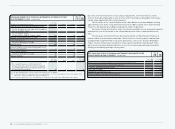
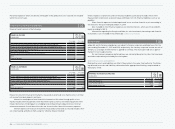
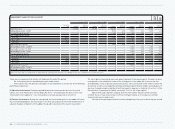
The fair value of all outstanding currency hedging instruments is as follows:
N
°-
28
FAIR VALUE
€ IN MILLIONS
Dec. 31, 2009 Dec. 31, 2008
Positive
fair
value
Negative
fair
value
Positive
fair
value
Negative
fair
value
Forward contracts 22 (74) 163 (43)
Currency options 28 (18) 40 (24)
Total 50 (92) 203 (67)