Reebok 2009 Annual Report Download - page 113
Download and view the complete annual report
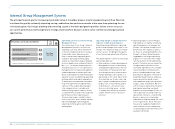
Please find page 113 of the 2009 Reebok annual report below. You can navigate through the pages in the report by either clicking on the pages listed below, or by using the keyword search tool below to find specific information within the annual report.-
 1
1 -
2
-
3
-
4
-
5
-
6
-
7
-
8
-
9
-
10
-
11
-
12
-
13
-
14
-
15
-
16
-
17
-
18
-
19
-
20
-
21
-
22
-
23
-
24
-
25
-
26
-
27
-
28
-
29
-
30
-
31
-
32
-
33
-
34
-
35
-
36
-
37
-
38
-
39
-
40
-
41
-
42
-
43
-
44
-
45
-
46
-
47
-
48
-
49
-
50
-
51
-
52
-
53
-
54
-
55
-
56
-
57
-
58
-
59
-
60
-
61
-
62
-
63
-
64
-
65
-
66
-
67
-
68
-
69
-
70
-
71
-
72
-
73
-
74
-
75
-
76
-
77
-
78
-
79
-
80
-
81
-
82
-
83
-
84
-
85
-
86
-
87
-
88
-
89
-
90
-
91
-
92
-
93
-
94
-
95
-
96
-
97
-
98
-
99
-
100
-
101
-
102
-
 103
103 -
 104
104 -
 105
105 -
 106
106 -
 107
107 -
 108
108 -
 109
109 -
 110
110 -
 111
111 -
 112
112 -
 113
113 -
 114
114 -
 115
115 -
 116
116 -
 117
117 -
 118
118 -
 119
119 -
 120
120 -
 121
121 -
 122
122 -
 123
123 -
124
-
125
-
126
-
127
-
128
-
129
-
130
-
131
-
132
-
133
-
134
-
135
-
136
-
137
-
138
-
139
-
140
-
141
-
142
-
143
-
144
-
145
-
146
-
147
-
148
-
149
-
150
-
151
-
152
-
153
-
154
-
155
-
156
-
157
-
158
-
159
-
160
-
161
-
162
-
163
-
164
-
165
-
166
-
167
-
168
-
169
-
170
-
171
-
172
-
173
-
174
-
175
-
176
-
177
-
178
-
179
-
180
-
181
-
182
-
183
-
184
-
185
-
186
-
187
-
188
-
189
-
190
-
191
-
192
-
193
-
194
-
195
-
196
-
197
-
198
-
199
-
200
-
201
-
202
-
203
-
204
-
205
-
206
-
207
-
208
-
209
-
210
-
211
-
212
-
213
-
214
-
215
-
216
-
217
-
218
-
219
-
220
-
221
-
222
-
223
-
224
-
225
-
226
-
227
-
228
-
229
-
230
-
231
-
232
-
233
-
234
 |
 |
GROUP MANAGEMENT REPORT – FINANCIAL REVIEW Internal Group Management System 109
N
°-
02
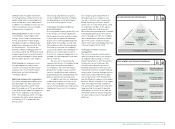
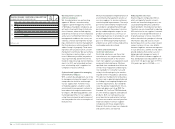
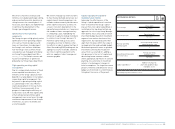
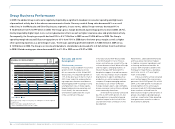
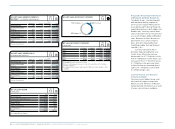
KEY FINANCIAL METRICS
1) Excluding acquisitions and finance leases.
We strive to maximise revenues and
minimise costs by detailed target setting,
and we constantly monitor deviations in
rolling forecasts on a monthly basis. If
necessary, action plans are implemented
to optimise the development of the
Group’s operating performance.
Optimisation of non-operating
components
Our Group also puts a high priority on the
optimisation of non-operating compon-
ents such as financial expenses and
taxes, as these items strongly impact
the Group’s cash outflows and there-
fore the Group’s free cash flow. Finan-
cial expenses are managed centrally by
our Group Treasury department see
Treasury, p. 128. The Group’s current and
future tax expenditure is optimised
globally by our Group Taxes department.
Tight operating working capital
management
Due to a comparatively low level of fixed
assets required in our business, the
efficiency of the Group’s balance sheet
depends to a large degree on our operat-
ing working capital management. Our
key metric is operating working capital
as a percentage of net sales. Monitor-
ing the development of this key metric
facilitates the measurement of our
progress in improving the efficiency of
our business cycle. We have significantly
enhanced operating working capital
management over recent years through
continuous improvement of our Group’s
inventories, accounts receivable and
accounts payable.
We strive to manage our inventory levels
to meet market demand and ensure fast
replenishment. Inventory ageing is con-
trolled to reduce inventory obsolescence
and to optimise clearance activities. As
a result, stock turn development is the
key performance indicator as it measures
the number of times average inventory
is sold during a year, highlighting the
efficiency of capital locked up in products
in relation to our Group’s business. To
minimise capital tied up in accounts
receivable, we strive to improve collec-
tion efforts in order to reduce the Days of
Sales Outstanding (DSO) and improve the
ageing of accounts receivable. Likewise,
we strive to optimise payment terms
with our suppliers to best manage our
accounts payable.
Capital expenditure targeted to
maximise future returns
Improving the effectiveness of the
Group’s capital expenditure is another
lever to maximise the Group’s operat-
ing cash flow. Our capital expenditure is
controlled with a top-down, bottom-up
approach: In a first step, Group Manage-
ment defines focus areas and an overall
investment budget based on investment
requests from various functions of the
organisation. Our operating units then
align their initiatives within the scope of
assigned priorities and available budget.
We evaluate potential return on planned
investments utilising the net present
value. Risk is accounted for, adding a
risk premium to the cost of capital and
decreasing future revenue streams
where appropriate. By means of scenario
planning, the sensitivity of investment
returns is tested against changes in
initial assumptions. For large investment
projects, timelines and deviations versus
budget are monitored on a monthly basis
throughout the course of the project.
Gross margin Gross profit
= × 100
Net sales
Operating margin Operating profit
= × 100
Net sales
Average operating
working capital
Sum of operating working
capital at quarter-end
=
4
Operating working capital
in % of net sales
Average operating
working capital
= × 100
Net sales
Capital expenditure 1 ) =
Additions of property,
plant and equipment plus
intangible assets