Reebok 2009 Annual Report Download - page 142
Download and view the complete annual report
Please find page 142 of the 2009 Reebok annual report below. You can navigate through the pages in the report by either clicking on the pages listed below, or by using the keyword search tool below to find specific information within the annual report.-
 1
1 -
2
-
3
-
4
-
5
-
6
-
7
-
8
-
9
-
10
-
11
-
12
-
13
-
14
-
15
-
16
-
17
-
18
-
19
-
20
-
21
-
22
-
23
-
24
-
25
-
26
-
27
-
28
-
29
-
30
-
31
-
32
-
33
-
34
-
35
-
36
-
37
-
38
-
39
-
40
-
41
-
42
-
43
-
44
-
45
-
46
-
47
-
48
-
49
-
50
-
51
-
52
-
53
-
54
-
55
-
56
-
57
-
58
-
59
-
60
-
61
-
62
-
63
-
64
-
65
-
66
-
67
-
68
-
69
-
70
-
71
-
72
-
73
-
74
-
75
-
76
-
77
-
78
-
79
-
80
-
81
-
82
-
83
-
84
-
85
-
86
-
87
-
88
-
89
-
90
-
91
-
92
-
93
-
94
-
95
-
96
-
97
-
98
-
99
-
100
-
101
-
102
-
103
-
104
-
105
-
106
-
107
-
108
-
109
-
110
-
111
-
112
-
113
-
114
-
115
-
116
-
117
-
118
-
119
-
120
-
121
-
122
-
123
-
124
-
125
-
126
-
127
-
128
-
129
-
130
-
131
-
 132
132 -
 133
133 -
 134
134 -
 135
135 -
 136
136 -
 137
137 -
 138
138 -
 139
139 -
 140
140 -
 141
141 -
 142
142 -
 143
143 -
 144
144 -
 145
145 -
 146
146 -
 147
147 -
 148
148 -
 149
149 -
 150
150 -
 151
151 -
 152
152 -
153
-
154
-
155
-
156
-
157
-
158
-
159
-
160
-
161
-
162
-
163
-
164
-
165
-
166
-
167
-
168
-
169
-
170
-
171
-
172
-
173
-
174
-
175
-
176
-
177
-
178
-
179
-
180
-
181
-
182
-
183
-
184
-
185
-
186
-
187
-
188
-
189
-
190
-
191
-
192
-
193
-
194
-
195
-
196
-
197
-
198
-
199
-
200
-
201
-
202
-
203
-
204
-
205
-
206
-
207
-
208
-
209
-
210
-
211
-
212
-
213
-
214
-
215
-
216
-
217
-
218
-
219
-
220
-
221
-
222
-
223
-
224
-
225
-
226
-
227
-
228
-
229
-
230
-
231
-
232
-
233
-
234
 |
 |
138 GROUP MANAGEMENT REPORT – FINANCIAL REVIEW BUSINESS PERFORMANCE BY SEGMENT Other Businesses Performance
Currency-neutral TaylorMade-adidas
Golf sales decline
In 2009, TaylorMade-adidas Golf revenues
decreased 2% on a currency-neutral
basis. This development was below initial
Management expectations of a low-
single-digit sales increase. Declines in all
major categories could not be offset by
the positive impact of Ashworth (con-
solidated since November 2008), which
contributed € 50 million to TaylorMade-
adidas Golf revenues in 2009. Currency
translation effects positively impacted
sales in euro terms. In 2009, TaylorMade-
adidas Golf revenues increased 2% to
€ 831 million from € 812 million in the
prior year.
Currency-neutral Rockport
sales decrease 8%
In 2009, Rockport revenues decreased
8% on a currency-neutral basis. Growth
in accessories was offset by declines in
footwear and apparel. Currency transla-
tion effects positively impacted sales in
euro terms. Revenues in the Rockport
segment decreased 5% to € 232 million
in 2009 from € 243 million in 2008.
Reebok-CCM Hockey sales decline 5%
on a currency-neutral basis
Currency-neutral Reebok-CCM Hockey
sales decreased 5% in 2009. This
develop ment was mainly due to lower
licensed apparel sales. Currency trans-
lation effects negatively impacted sales
in euro terms. Reebok-CCM Hockey
revenues decreased 6% to € 177 million
in 2009 from € 188 million in 2008.
Gross margin negatively impacted
by difficult pricing environment
Gross margin decreased 2.8 percentage
points to 39.4% in 2009 from 42.2% in
2008. This was mainly due to price repo-
sitioning initiatives at TaylorMade-adidas
Golf due to the negative golf market
development. As a result, gross profit
declined 7% to € 506 million in 2009
versus € 543 million in 2008.
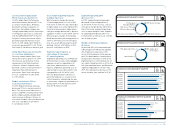
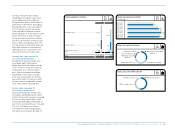
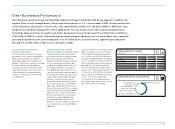
N
°-
03
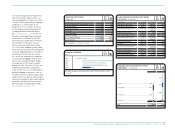
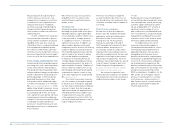
OTHER BUSINESSES NET SALES BY QUARTER
€ IN MILLIONS
Q1 2008
Q1 2009
Q2 2008
Q2 2009
Q3 2008
Q3 2009
Q4 2008
Q4 2009
285
294
336
359
347
322
318
308
N
°-
04
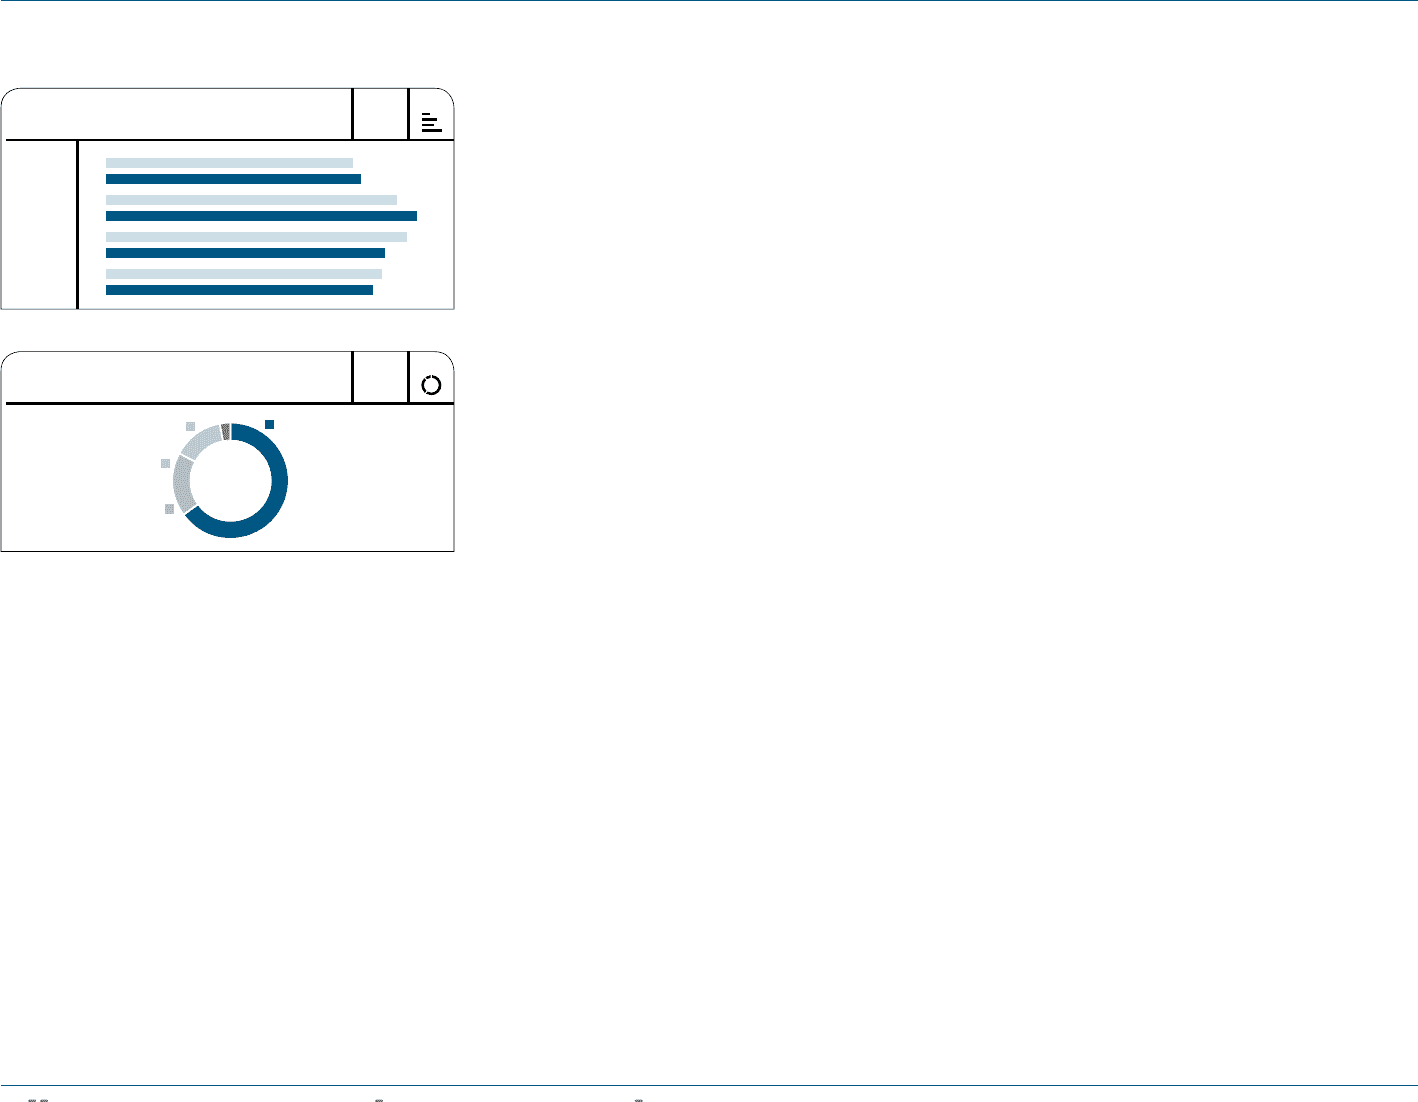
OTHER BUSINESSES NET SALES BY BRAND
14% Reebok-CCM
Hockey
3% Other centrally
managed brands
18% Rockport
65% TaylorMade-
adidas Golf
Operating costs as a percentage of
sales up 1.5 percentage points
Operating costs as a percentage of sales
increased 1.5 percentage points to 17.5%
(2008: 16.0%). Integration expenses of
€ 21 million and the non-recurrence
of a prior year book gain related to
the acquisition of Ashworth were the
primary drivers of this increase. In euro
terms, operating costs increased 9% to
€ 224 million in 2009 from € 206 million
in 2008.