Reebok 2009 Annual Report Download - page 118
Download and view the complete annual report
Please find page 118 of the 2009 Reebok annual report below. You can navigate through the pages in the report by either clicking on the pages listed below, or by using the keyword search tool below to find specific information within the annual report.-
 1
1 -
2
-
3
-
4
-
5
-
6
-
7
-
8
-
9
-
10
-
11
-
12
-
13
-
14
-
15
-
16
-
17
-
18
-
19
-
20
-
21
-
22
-
23
-
24
-
25
-
26
-
27
-
28
-
29
-
30
-
31
-
32
-
33
-
34
-
35
-
36
-
37
-
38
-
39
-
40
-
41
-
42
-
43
-
44
-
45
-
46
-
47
-
48
-
49
-
50
-
51
-
52
-
53
-
54
-
55
-
56
-
57
-
58
-
59
-
60
-
61
-
62
-
63
-
64
-
65
-
66
-
67
-
68
-
69
-
70
-
71
-
72
-
73
-
74
-
75
-
76
-
77
-
78
-
79
-
80
-
81
-
82
-
83
-
84
-
85
-
86
-
87
-
88
-
89
-
90
-
91
-
92
-
93
-
94
-
95
-
96
-
97
-
98
-
99
-
100
-
101
-
102
-
103
-
104
-
105
-
106
-
107
-
 108
108 -
 109
109 -
 110
110 -
 111
111 -
 112
112 -
 113
113 -
 114
114 -
 115
115 -
 116
116 -
 117
117 -
 118
118 -
 119
119 -
 120
120 -
 121
121 -
 122
122 -
 123
123 -
 124
124 -
 125
125 -
 126
126 -
 127
127 -
 128
128 -
129
-
130
-
131
-
132
-
133
-
134
-
135
-
136
-
137
-
138
-
139
-
140
-
141
-
142
-
143
-
144
-
145
-
146
-
147
-
148
-
149
-
150
-
151
-
152
-
153
-
154
-
155
-
156
-
157
-
158
-
159
-
160
-
161
-
162
-
163
-
164
-
165
-
166
-
167
-
168
-
169
-
170
-
171
-
172
-
173
-
174
-
175
-
176
-
177
-
178
-
179
-
180
-
181
-
182
-
183
-
184
-
185
-
186
-
187
-
188
-
189
-
190
-
191
-
192
-
193
-
194
-
195
-
196
-
197
-
198
-
199
-
200
-
201
-
202
-
203
-
204
-
205
-
206
-
207
-
208
-
209
-
210
-
211
-
212
-
213
-
214
-
215
-
216
-
217
-
218
-
219
-
220
-
221
-
222
-
223
-
224
-
225
-
226
-
227
-
228
-
229
-
230
-
231
-
232
-
233
-
234
 |
 |
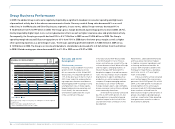
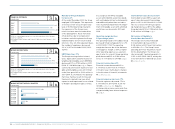
114 GROUP MANAGEMENT REPORT – FINANCIAL REVIEW GROUP BUSINESS PERFORMANCE Economic and Sector Development
N
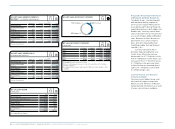
°-
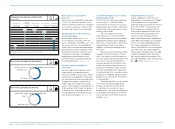
07
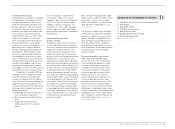
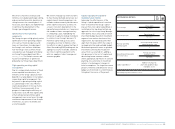
NET SALES
€ IN MILLIONS
2005 1 )
2006 2 )
2007
2008
2009
6,636
10,084
10,299
10,799
10,381
1) Reflects continuing operations as a result of the divestiture of the Salomon
business segment.
2) Including Reebok, Rockport and Reebok-CCM Hockey from February 1, 2006
onwards.
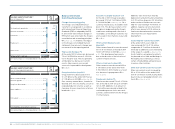
N
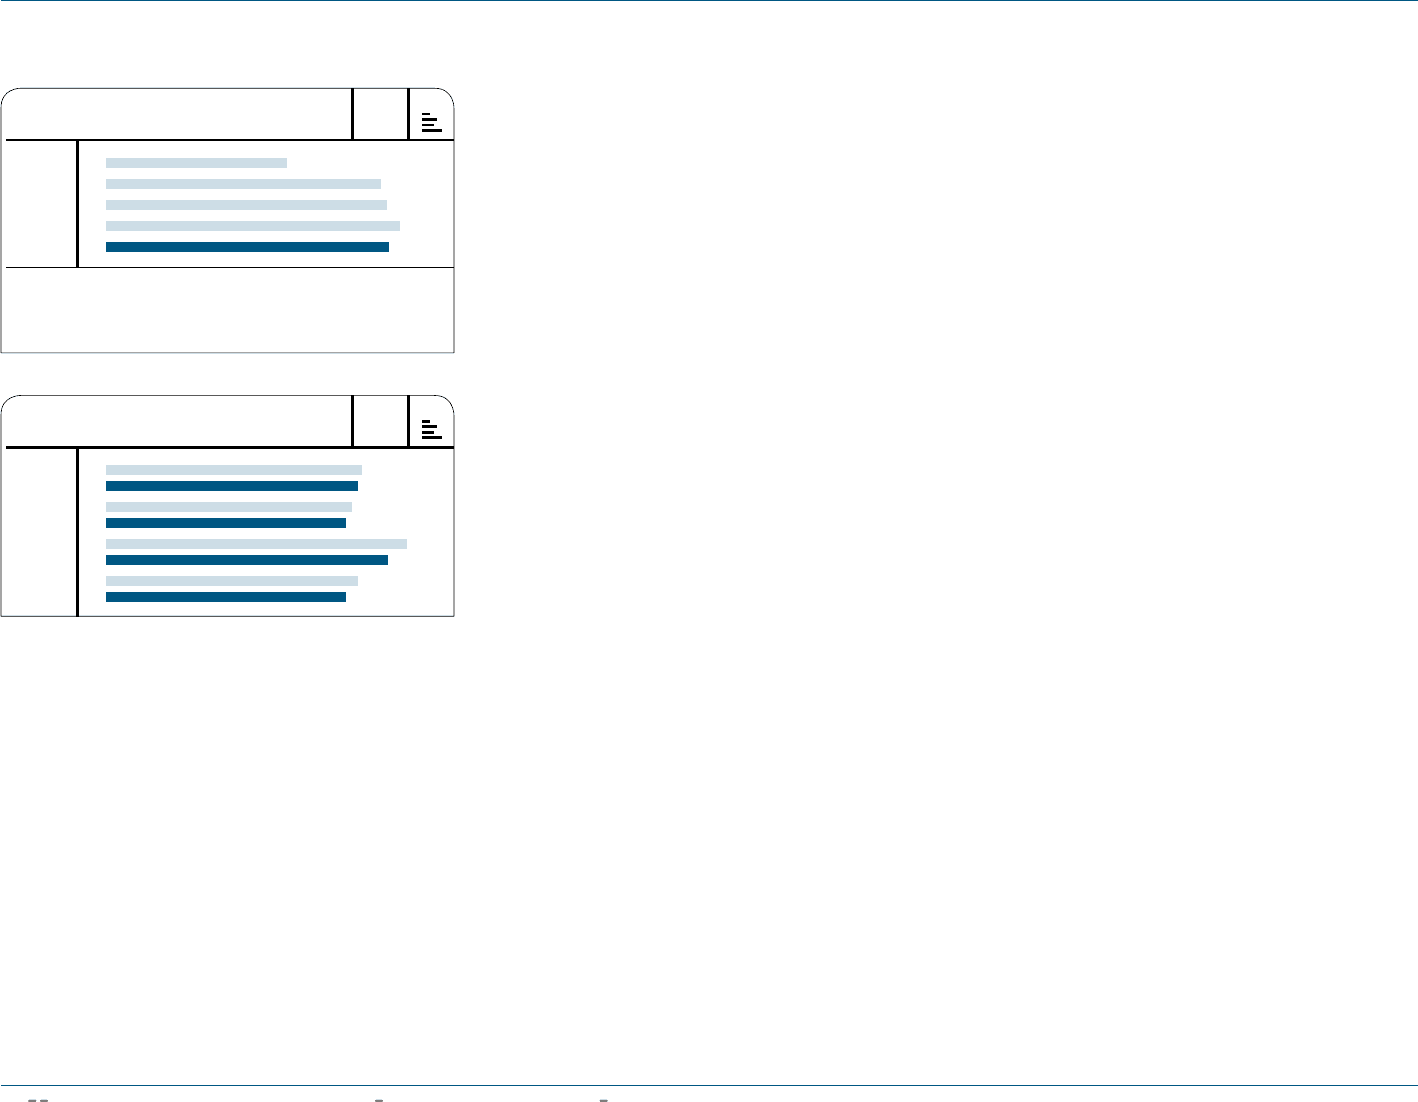
°-
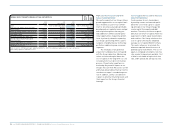
08
NET SALES BY QUARTER
€ IN MILLIONS
Q1 2008
Q1 2009
Q2 2008
Q2 2009
Q3 2008
Q3 2009
Q4 2008
Q4 2009
2,621
2,577
2,521
2,457
3,083
2,888
2,574
2,458
Sales in both the footwear and apparel
segments declined in Europe, albeit to a
different extent. We estimate that foot-
wear sales decreased at a low-single-
digit rate, whereas apparel sales were
probably down at a mid-single digit rate.
While selling volumes are expected to
be only slightly below prior year levels,
average selling prices declined consider-
ably. On a category basis, the European
market was positively impacted by growth
in the outdoor category, which, however,
could not offset lower sales in most other
categories.
North American sporting goods
industry suffers from tough retail
market
In the USA, sporting goods sales declined
due to the challenging retail environment
as retailers focused on keeping inven-
tory levels low amid lacklustre consumer
demand as well as store rationalisation.
While sales decreased in both footwear
and apparel, footwear sales were less
affected and are expected to have
declined at a low-single-digit rate. The
relative strength of this category was
mainly attributable to increasing average
selling prices, which partly offset lower
volumes. One of the contributors to
higher average selling prices was the
emerging toning category, which grew
at a strong double-digit rate during 2009.
According to our estimates, apparel
sales were down at a mid- single-digit
rate, as increasing demand for special
functional apparel such as compression
wear partly offset weakness in estab-
lished categories such as basketball and
lifestyle. Hardware sales, in particular
high price point equipment products such
as golf clubs, were negatively affected by
cautious consumer spending. Declining
average selling prices due to the highly
promotional retail environment added to
negative effects of lower volumes in this
category.
Growth of Asian sporting goods
industry slumps
The growth of the Asian sporting goods
industry decelerated compared to 2008,
primarily driven by considerably slower
expansion in emerging markets as well
as weak consumer spending in Japan.
In particular, sporting goods sales in
Greater China were negatively impacted
by the clearance of high excess inven-
tories accumulated in the aftermath of
the Olympic Games held in Beijing in
2008 and subdued consumer demand at
the beginning of the year. We assume that
sporting goods retail sales in China grew
at a mid-teens rate, which represents a
significant deceleration compared to the
prior year.
In Japan, industry sales were influ-
enced by the country’s steep economic
recession and its spillover effects on
consumer spending, especially in the
first half of the year. Weak private con-
sumption caused the overall industry to
decrease at a high-single-digit rate with
similar declines in footwear and apparel
sales.
Latin American sporting goods market
resilient against macroeconomic trend
In Latin America, according to our
estimates, the sporting goods industry
developed better than the general
economy. Even though growth momen-
tum slowed compared to the prior year,
sporting goods sales remained more
resilient against the downward trend in
the macro economic environment, with
growth in both footwear and apparel.
adidas Group and competitors suffer
from weak economic environment
adidas Group revenues as well as those
of many competitors and retailers
decreased in 2009. However, in some
regions sales of our Group and other
major sporting goods companies
declined more significantly than GDP.
Increasing unemployment rates and
subdued consumer spending contributed
to this development.