Reebok 2009 Annual Report Download - page 145
Download and view the complete annual report
Please find page 145 of the 2009 Reebok annual report below. You can navigate through the pages in the report by either clicking on the pages listed below, or by using the keyword search tool below to find specific information within the annual report.-
 1
1 -
2
-
3
-
4
-
5
-
6
-
7
-
8
-
9
-
10
-
11
-
12
-
13
-
14
-
15
-
16
-
17
-
18
-
19
-
20
-
21
-
22
-
23
-
24
-
25
-
26
-
27
-
28
-
29
-
30
-
31
-
32
-
33
-
34
-
35
-
36
-
37
-
38
-
39
-
40
-
41
-
42
-
43
-
44
-
45
-
46
-
47
-
48
-
49
-
50
-
51
-
52
-
53
-
54
-
55
-
56
-
57
-
58
-
59
-
60
-
61
-
62
-
63
-
64
-
65
-
66
-
67
-
68
-
69
-
70
-
71
-
72
-
73
-
74
-
75
-
76
-
77
-
78
-
79
-
80
-
81
-
82
-
83
-
84
-
85
-
86
-
87
-
88
-
89
-
90
-
91
-
92
-
93
-
94
-
95
-
96
-
97
-
98
-
99
-
100
-
101
-
102
-
103
-
104
-
105
-
106
-
107
-
108
-
109
-
110
-
111
-
112
-
113
-
114
-
115
-
116
-
117
-
118
-
119
-
120
-
121
-
122
-
123
-
124
-
125
-
126
-
127
-
128
-
129
-
130
-
131
-
132
-
133
-
134
-
 135
135 -
 136
136 -
 137
137 -
 138
138 -
 139
139 -
 140
140 -
 141
141 -
 142
142 -
 143
143 -
 144
144 -
 145
145 -
 146
146 -
 147
147 -
 148
148 -
 149
149 -
 150
150 -
 151
151 -
 152
152 -
 153
153 -
 154
154 -
 155
155 -
156
-
157
-
158
-
159
-
160
-
161
-
162
-
163
-
164
-
165
-
166
-
167
-
168
-
169
-
170
-
171
-
172
-
173
-
174
-
175
-
176
-
177
-
178
-
179
-
180
-
181
-
182
-
183
-
184
-
185
-
186
-
187
-
188
-
189
-
190
-
191
-
192
-
193
-
194
-
195
-
196
-
197
-
198
-
199
-
200
-
201
-
202
-
203
-
204
-
205
-
206
-
207
-
208
-
209
-
210
-
211
-
212
-
213
-
214
-
215
-
216
-
217
-
218
-
219
-
220
-
221
-
222
-
223
-
224
-
225
-
226
-
227
-
228
-
229
-
230
-
231
-
232
-
233
-
234
 |
 |

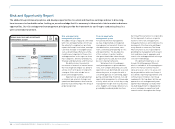
GROUP MANAGEMENT REPORT – FINANCIAL REVIEW Risk and Opportunity Report 141
The main components of our risk and
opportunity management process are:
Risk and opportunity identification:
The adidas Group continuously moni-
tors the macroeconomic environment,
developments in the sporting goods
industry, as well as internal processes to
identify risks and opportunities as early
as possible. Local business units have
primary responsibility for the identifica-
tion and management of risks and oppor-
tunities. Our Group Finance function has
defined a catalogue of potential risks
and opportunities for our Group to assist
in the identification process. In addition
to the potential financial impacts from
changes in the overall macroeconomic,
political and social landscape, each mar-
ket actively monitors brand, distribution
channel and price point developments in
our core sport, leisure lifestyle and sport
fusion markets. A key element of the
identification process is primary qualita-
tive and quantitative research such as
trend scouting, consumer surveys and
feedback from our business partners and
controlled space network. These efforts
are supported by global market research
and competitor analysis. Here, secondary
material such as NPD Sports Tracking
Europe market research data is analysed
and global relationships with independ-
ent trend and media agencies such as
Trendwatching.com are maintained.
Through this process we seek to identify
the markets, categories, consumer target
groups and product styles which show
most potential for future growth at a local
and global level. Equally, our analysis
focuses on those areas that are at risk
of saturation, increased competition or
changing consumer tastes.
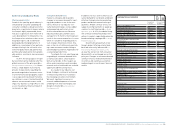
Risk and opportunity assessment:
Identified risks and opportunities are
assessed with respect to (1) occurrence
probability, and (2) potential contribu-
tion to loss or profit, with contribution
being defined as operating profit before
intra-Group royalties. The occurrence
probability of individual risks and
opportunities is evaluated on a scale of
0 to 100% likelihood. In this report, we
summarise these findings by utilising
“high”, “medium” or “low” classifications
to represent an aggregate likelihood for
various risk and opportunity categories.
As risks and opportunities have differ-
ent characteristics, we have defined
separate methodologies for assess-
ing the potential financial impact. With
respect to risks, the extent of potential
loss is measured on a case-by-case basis
as the contribution deviation from the
most recent forecast under the assump-
tion that the risk fully materialises. This
calculation also reflects the effects from
risk- compensating measures. In assess-
ing the potential contribution from oppor-
tunities, each opportunity is appraised
with respect to viability, commerciality,
potential risks and the expected profit
contribution. This approach is applied to
longer-term strategic prospects but also
to shorter-term tactical and opportunistic
initiatives at both the Group and, more
extensively, the brand and market level.
Risk and opportunity treatment: Risks
and opportunities are treated in accord-
ance with the Group’s risk and opportu-
nity management principles as described
in the Risk Management Manual. Line
management in cooperation with the
Group Finance function and, in excep-
tional cases, the Executive Board and/or
Supervisory Board, decides which indi-
vidual risks we accept or avoid and the
opportunities to pursue or forgo. As part
of this process, we also decide on which
risk- compensating or transfer measures
will be implemented. Similarly, to max-
imise opportunities, it may be necessary
to reduce or limit distribution in order to
protect prices and margins or prolong
product lifecycles. In some cases, we also
seek to transfer the responsibility for
execution for certain risks and oppor-
tunities to third parties (e.g. insurance,
outsourcing, distribution agreements or
brand sub-licensing).
Risk and opportunity monitoring and
controlling: A primary objective of our
integrated risk and opportunity manage-
ment system is to increase the transpar-
ency of Group risks and opportunities.
In addition, we also seek to measure the
success of our risk-compensating initia-
tives. The Group centrally monitors each
of these efforts on a frequent basis. In
particular, the Group Finance function
regularly examines the results of actions
taken by operational management to
accept, avoid, reduce or transfer risks
over time. With respect to opportunities,
we regularly monitor the objectives and
key performance indicators established
during the initial identification and evalu-
ation process. This not only facilitates the
validation of opportunities but also allows
us to adapt and refine our products,
communication and distribution strategy
to ongoing developments in our rapidly
changing marketplace. In particular,
we collaborate with our manufacturing
partners and retail customers to evaluate
the impact of our growth and efficiency
initiatives. Feedback is relayed in a timely
manner to product, marketing and con-
trolling functions.