Reebok 2009 Annual Report Download - page 140
Download and view the complete annual report
Please find page 140 of the 2009 Reebok annual report below. You can navigate through the pages in the report by either clicking on the pages listed below, or by using the keyword search tool below to find specific information within the annual report.-
 1
1 -
2
-
3
-
4
-
5
-
6
-
7
-
8
-
9
-
10
-
11
-
12
-
13
-
14
-
15
-
16
-
17
-
18
-
19
-
20
-
21
-
22
-
23
-
24
-
25
-
26
-
27
-
28
-
29
-
30
-
31
-
32
-
33
-
34
-
35
-
36
-
37
-
38
-
39
-
40
-
41
-
42
-
43
-
44
-
45
-
46
-
47
-
48
-
49
-
50
-
51
-
52
-
53
-
54
-
55
-
56
-
57
-
58
-
59
-
60
-
61
-
62
-
63
-
64
-
65
-
66
-
67
-
68
-
69
-
70
-
71
-
72
-
73
-
74
-
75
-
76
-
77
-
78
-
79
-
80
-
81
-
82
-
83
-
84
-
85
-
86
-
87
-
88
-
89
-
90
-
91
-
92
-
93
-
94
-
95
-
96
-
97
-
98
-
99
-
100
-
101
-
102
-
103
-
104
-
105
-
106
-
107
-
108
-
109
-
110
-
111
-
112
-
113
-
114
-
115
-
116
-
117
-
118
-
119
-
120
-
121
-
122
-
123
-
124
-
125
-
126
-
127
-
128
-
129
-
 130
130 -
 131
131 -
 132
132 -
 133
133 -
 134
134 -
 135
135 -
 136
136 -
 137
137 -
 138
138 -
 139
139 -
 140
140 -
 141
141 -
 142
142 -
 143
143 -
 144
144 -
 145
145 -
 146
146 -
 147
147 -
 148
148 -
 149
149 -
 150
150 -
151
-
152
-
153
-
154
-
155
-
156
-
157
-
158
-
159
-
160
-
161
-
162
-
163
-
164
-
165
-
166
-
167
-
168
-
169
-
170
-
171
-
172
-
173
-
174
-
175
-
176
-
177
-
178
-
179
-
180
-
181
-
182
-
183
-
184
-
185
-
186
-
187
-
188
-
189
-
190
-
191
-
192
-
193
-
194
-
195
-
196
-
197
-
198
-
199
-
200
-
201
-
202
-
203
-
204
-
205
-
206
-
207
-
208
-
209
-
210
-
211
-
212
-
213
-
214
-
215
-
216
-
217
-
218
-
219
-
220
-
221
-
222
-
223
-
224
-
225
-
226
-
227
-
228
-
229
-
230
-
231
-
232
-
233
-
234
 |
 |
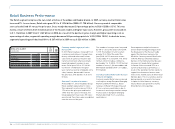
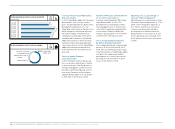
136 GROUP MANAGEMENT REPORT – FINANCIAL REVIEW BUSINESS PERFORMANCE BY SEGMENT Retail Business Performance
N
°-
06
N
°-
07
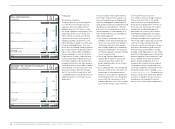
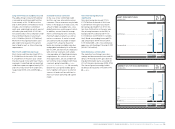
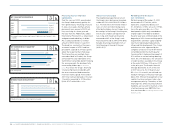
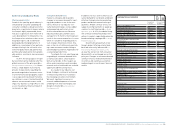
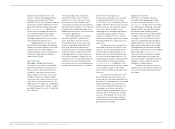
RETAIL GROSS MARGIN BY QUARTER
IN %
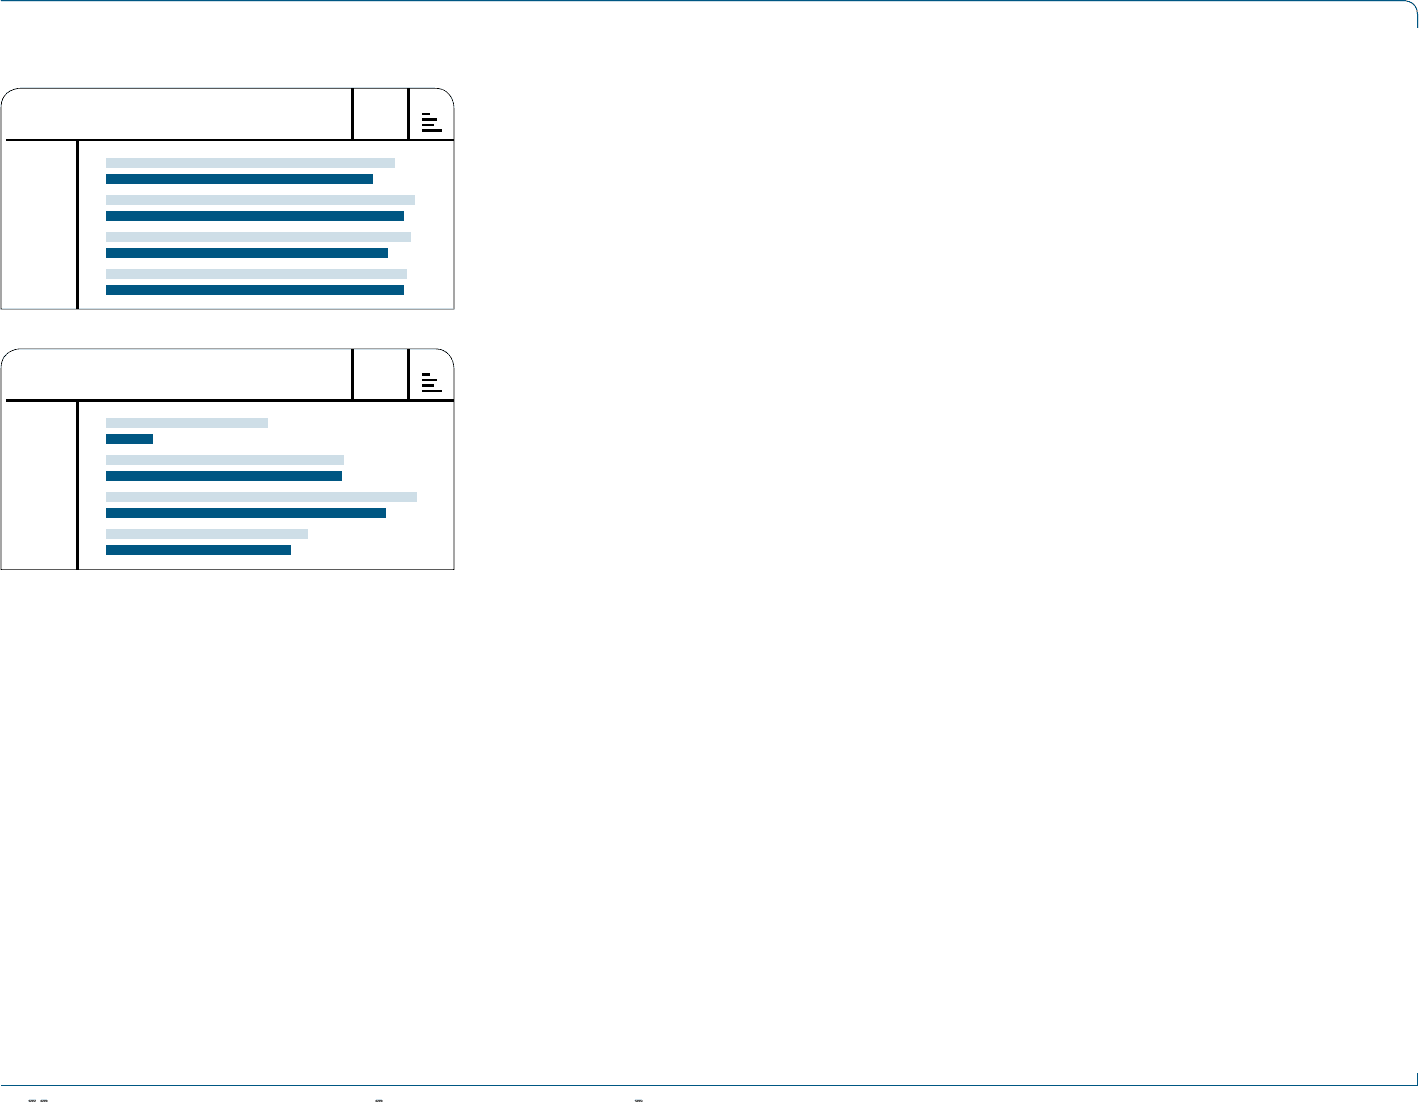
RETAIL OPERATING PROFIT BY QUARTER
€ IN MILLIONS
Q1 2008
Q1 2009
Q2 2008
Q2 2009
Q3 2008
Q3 2009
Q4 2008
Q4 2009
Q1 2008
Q1 2009
Q2 2008
Q2 2009
Q3 2008
Q3 2009
Q4 2008
Q4 2009
58.9
54.5
63.0
60.8
62.2
57.6
61.5
60.7
58
17
85
84
111
100
72
66
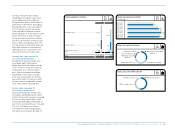
Currency-neutral sales from other
retail formats increase 28%
Revenues from other retail formats
include adidas and Reebok concession
corners and e-commerce operations.
In 2009, sales from other retail formats
increased 28% on a currency-neutral
basis. Growth was driven by improve-
ments in both concession corners and
e-commerce. In euro terms, revenues
from other retail formats increased 27%
to € 68 million in 2009 from € 54 million
in 2008. Currency-neutral comparable
sales from other formats increased 20%.
adidas and Reebok branded
Retail sales increase
In 2009, adidas Group Retail sales
increased at both adidas and Reebok.
Currency-neutral adidas Sport
Performance sales increased 5%.
Currency-neutral adidas Sport Style
revenues grew 20% in the period.
Currency-neutral Reebok sales were
7% higher compared to the prior year.
Comparable store sales at the adidas
brand declined at a high-single-
digit rate, whereas Reebok sales
decreased at a low-single-digit rate.
Currency translation effects positively
impacted revenues in euro terms.
adidas own-retail sales increased
10% to € 1.567 billion in 2009 from
€ 1.430 billion in 2008. Own-retail sales
of Reebok branded products also grew
10% to € 339 million in 2009 (2008:
€ 307 million).
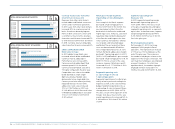
Retail gross margin negatively
impacted by currency devaluation
effects
Gross margin in the Retail segment
decreased 2.9 percentage points to
58.6% in 2009 from 61.5% in 2008. This
was mainly due to effects from the
devaluation of the Russian rouble and
higher input costs. In Russia, sales were
negatively impacted by the devaluation
of the Russian rouble against the func-
tional currency, the US dollar, whereas
cost of goods sold remained largely
unaffected. The vast majority of these
costs are denominated in US dollars.
Gross margin declined across all store
formats. By brand, adidas gross margin
declined 2.7 percentage points to 60.9%
(2008: 63.6%) and Reebok’s gross margin
decreased 3.8 percentage points to 48.1%
(2008: 51.9%). As a result of the sales
increase, however, Retail gross profit
increased 4% to € 1.116 billion in 2009
from € 1.069 billion in 2008.
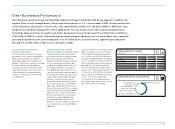
Segmental operating costs
as a percentage of sales up
1.8 percentage points
Segmental operating costs in Retail pri-
marily relate to personnel and logistics
expenses as well as the sales working
budget. Segmental operating costs as
a percentage of sales increased 1.8 per-
centage points to 44.5% (2008: 42.7%).
This was a result of the expansion of the
Group’s store base. In euro terms, seg-
mental operating costs increased 14% to
€ 849 million in 2009 from € 742 million
in 2008.
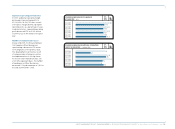
Segmental operating profit
decreases 18%
In 2009, segmental operating margin
decreased 4.8 percentage points to
14.0% (2008: 18.8%). This was a result
of the gross margin decline and higher
segmental operating costs as a percent-
age of sales. In absolute terms, segmen-
tal operating profit decreased 18% to
€ 267 million in 2009 versus € 326 mil-
lion in the prior year.
Retail employee base grows
On December 31, 2009, the Group
employed 19,599 people in Retail
operations. This represents an increase
of 11% versus 17,614 employees at the
end of the prior year. The increase in
the number of employees relates to the
expansion of the Group’s store base. The
vast majority of employees are employed
on a part-time basis. On a full-time
equivalent basis, the number of people
employed in Retail increased 1% to
15,252 at the end of 2009 (2008: 15,168).