Reebok 2009 Annual Report Download - page 208
Download and view the complete annual report
Please find page 208 of the 2009 Reebok annual report below. You can navigate through the pages in the report by either clicking on the pages listed below, or by using the keyword search tool below to find specific information within the annual report.-
 1
1 -
2
-
3
-
4
-
5
-
6
-
7
-
8
-
9
-
10
-
11
-
12
-
13
-
14
-
15
-
16
-
17
-
18
-
19
-
20
-
21
-
22
-
23
-
24
-
25
-
26
-
27
-
28
-
29
-
30
-
31
-
32
-
33
-
34
-
35
-
36
-
37
-
38
-
39
-
40
-
41
-
42
-
43
-
44
-
45
-
46
-
47
-
48
-
49
-
50
-
51
-
52
-
53
-
54
-
55
-
56
-
57
-
58
-
59
-
60
-
61
-
62
-
63
-
64
-
65
-
66
-
67
-
68
-
69
-
70
-
71
-
72
-
73
-
74
-
75
-
76
-
77
-
78
-
79
-
80
-
81
-
82
-
83
-
84
-
85
-
86
-
87
-
88
-
89
-
90
-
91
-
92
-
93
-
94
-
95
-
96
-
97
-
98
-
99
-
100
-
101
-
102
-
103
-
104
-
105
-
106
-
107
-
108
-
109
-
110
-
111
-
112
-
113
-
114
-
115
-
116
-
117
-
118
-
119
-
120
-
121
-
122
-
123
-
124
-
125
-
126
-
127
-
128
-
129
-
130
-
131
-
132
-
133
-
134
-
135
-
136
-
137
-
138
-
139
-
140
-
141
-
142
-
143
-
144
-
145
-
146
-
147
-
148
-
149
-
150
-
151
-
152
-
153
-
154
-
155
-
156
-
157
-
158
-
159
-
160
-
161
-
162
-
163
-
164
-
165
-
166
-
167
-
168
-
169
-
170
-
171
-
172
-
173
-
174
-
175
-
176
-
177
-
178
-
179
-
180
-
181
-
182
-
183
-
184
-
185
-
186
-
187
-
188
-
189
-
190
-
191
-
192
-
193
-
194
-
195
-
196
-
197
-
 198
198 -
 199
199 -
 200
200 -
 201
201 -
 202
202 -
 203
203 -
 204
204 -
 205
205 -
 206
206 -
 207
207 -
 208
208 -
 209
209 -
 210
210 -
 211
211 -
 212
212 -
 213
213 -
 214
214 -
 215
215 -
 216
216 -
 217
217 -
 218
218 -
219
-
220
-
221
-
222
-
223
-
224
-
225
-
226
-
227
-
228
-
229
-
230
-
231
-
232
-
233
-
234
 |
 |
204 CONSOLIDATED FINANCIAL STATEMENTS Notes
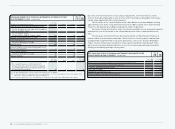
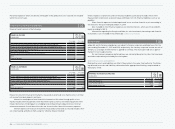
For 2009, the line “non-deductible expenses” includes tax benefits of in total € 57 million related
to the favourable resolution of foreign tax disputes for prior years.
The line ”losses for which benefits were not recognisable and changes in valuation allow-
ances” mainly relates to changes in valuation allowances of the US tax group.
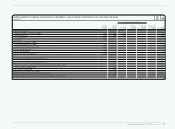
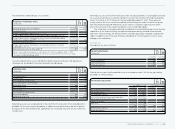
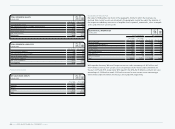
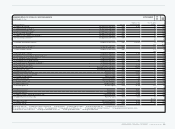
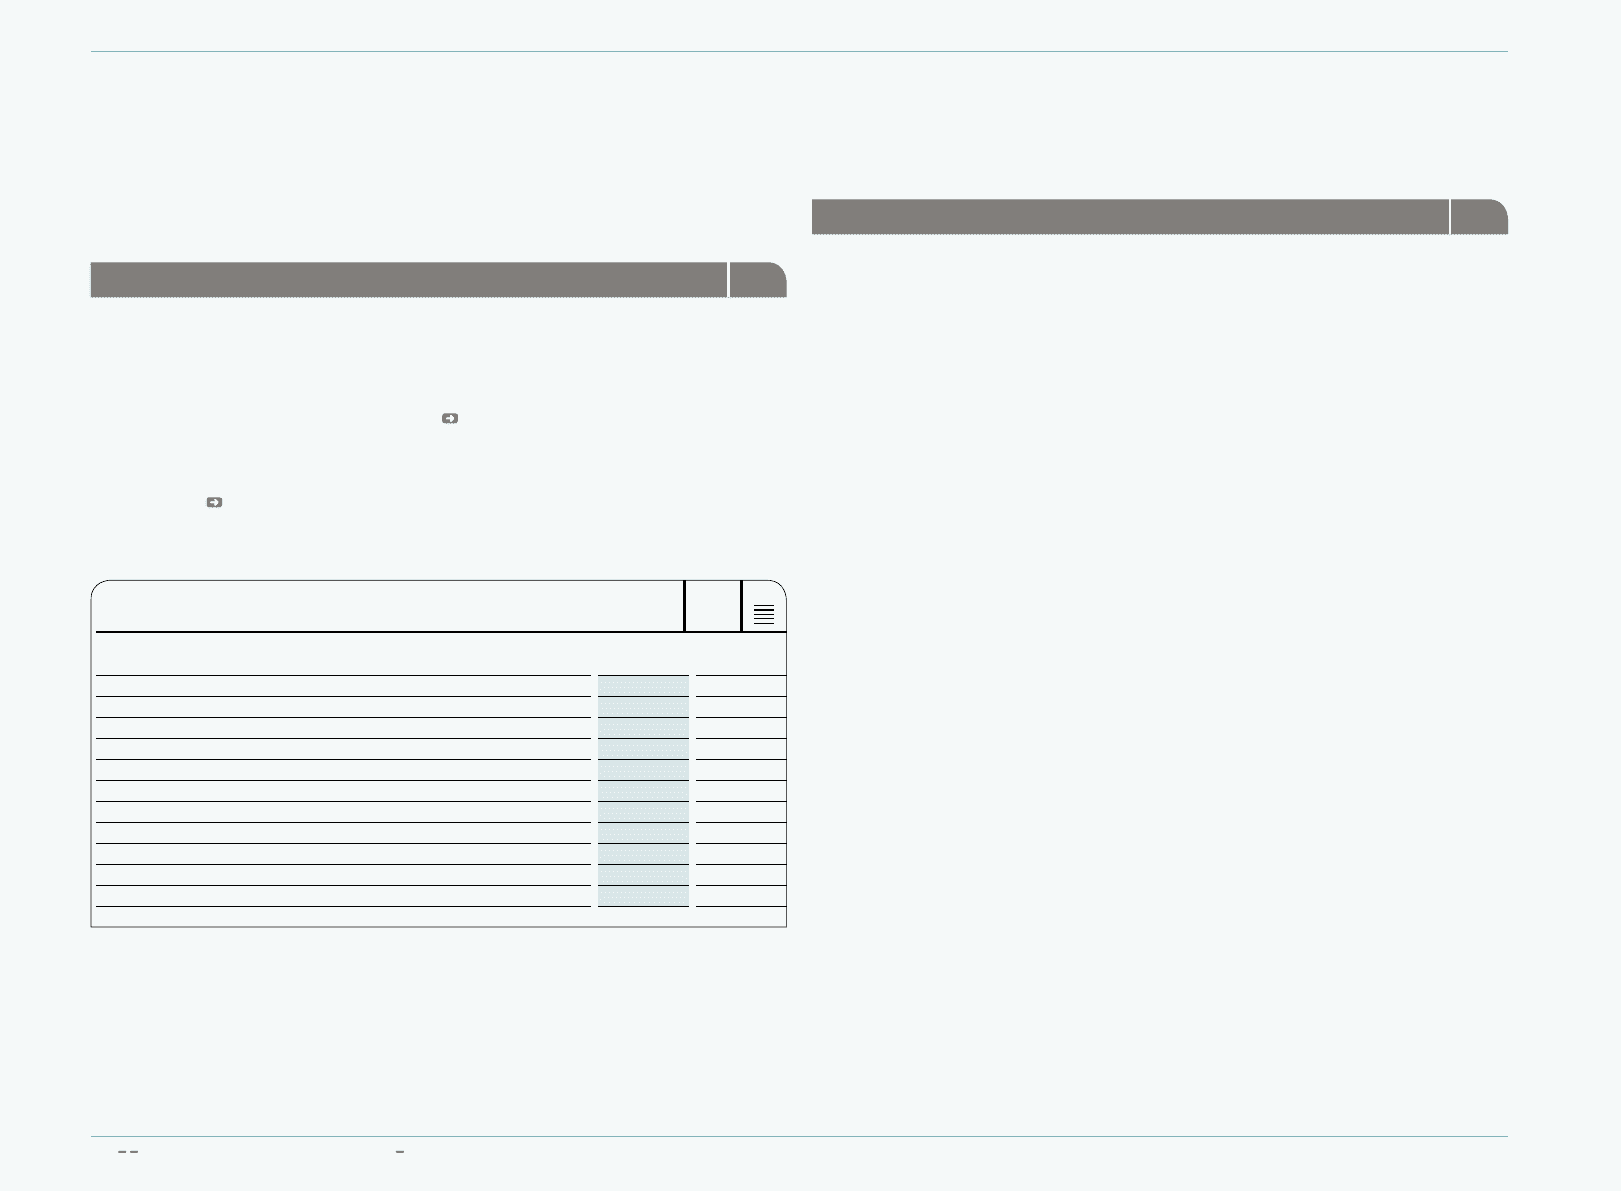
Earnings per share 34
Basic earnings per share are calculated by dividing the net income attributable to shareholders by
the weighted average number of shares outstanding during the year.
Dilutive potential shares arose under the Management Share Option Plan (MSOP) of adidas
AG, which was implemented in 1999. As the required performance criteria for the exercise of the
stock options of all tranches of the share option plan have been fulfilled, dilutive potential shares
impact the diluted earnings per share calculation see Note 38.
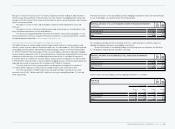
It is also necessary to include dilutive potential shares arising from the convertible bond
issuance in October 2003 in the calculation of diluted earnings per share of the financial year
2009 (until conversion) and 2008 as the required conversion criteria were fulfilled at the balance
sheet date 2008 see Note 17. As a result, the convertible bond is assumed to have been converted
into ordinary shares and the net income is adjusted to eliminate the interest expense less the tax
effect.
N
°-
34
EARNINGS PER SHARE
Year ending
Dec. 31, 2009 Year ending
Dec. 31, 2008
Net income attributable to shareholders (€ in millions) 245 642
Weighted average number of shares 196,220,166 197,562,346
Basic earnings per share (in €) 1.25 3.25
Net income attributable to shareholders (€ in millions) 245 642
Interest expense on convertible bond, net of taxes (€ in millions) 10 13
Net income used to determine diluted earnings per share (€ in millions) 255 655
Weighted average number of shares 196,220,166 197,562,346
Weighted share options 34,369 86,542
Weighted assumed conversion convertible bond 12,983,564 15,684,315
Weighted average number of shares for diluted earnings per share 209,238,099 213,333,203
Diluted earnings per share (in €) 1.22 3.07
Notes – Additional InformationNotes – Additional Information
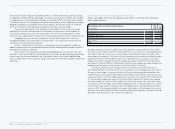
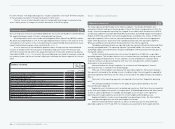
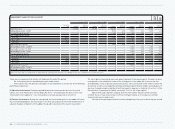
Segmental information 35
The Group operates predominately in one industry segment – the design, distribution and
marketing of athletic and sports lifestyle products. Due to the Group’s reorganisation in 2009, the
Group’s internal management reporting has changed. In accordance with the definition of IFRS 8,
six operating segments have been identified: Wholesale, Retail, TaylorMade-adidas Golf, Rockport,
Reebok-CCM Hockey and Other centrally managed brands. According to the criteria of IFRS 8 for
reportable segments, the first two are reported separately while the other four are aggregated
under “Other Businesses” due to their only subordinate materiality. The reportable segments
Wholesale and Retail correspond with the presentation in the internal reporting.
The adidas and Reebok brands are reported under the segments Wholesale, Retail and Other
centrally managed brands. The operating segment TaylorMade-adidas Golf contains the brands
TaylorMade, adidas Golf and Ashworth. Rockport and Reebok-CCM Hockey were formerly part of
the Reebok segment.
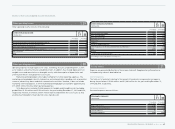
Certain centralised Group functions do not meet the definition of IFRS 8 for a reportable
operating segment. This includes functions such as central treasury, worldwide sourcing as well
as other headquarter departments. Assets, liabilities, income and expenses relating to these
corporate functions are presented together with other non-allocable items and intersegment
eliminations in the reconciliations.
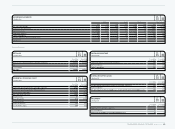
Information about the Group’s segments, in accordance with Management’s internal
reporting structure, is outlined on the following page.
There are no intersegment sales between the reportable segments. Transactions between
the segments are based on the dealing-at-arm’s-length principle. Accounting policies applied for
reporting segmental information are the same as those used for the adidas Group as described in
Note 2.
The results of the operating segments are reported in the line item ”Segmental operating
profit”.
The chief operating decision maker for the adidas Group has been defined as the joint
Executive Board of adidas AG.
Segmental assets include accounts receivable and inventories. Only these items are reported
to the chief operating decision maker on a regular basis. Scheduled depreciation and amortisation
as well as capital expenditures for tangible and intangible assets are part of the segmental
reporting, even though segmental assets do not contain tangible and intangible assets.
Segmental liabilities contain accounts payable from operating activities. No other liability
items are reported regularly to the chief operating decision maker.
Interest income and interest expenses as well as income taxes are not allocated to the
reportable segments. In 2009 and 2008, no companies are accounted for by the equity method.