Reebok 2009 Annual Report Download - page 186
Download and view the complete annual report
Please find page 186 of the 2009 Reebok annual report below. You can navigate through the pages in the report by either clicking on the pages listed below, or by using the keyword search tool below to find specific information within the annual report.-
 1
1 -
2
-
3
-
4
-
5
-
6
-
7
-
8
-
9
-
10
-
11
-
12
-
13
-
14
-
15
-
16
-
17
-
18
-
19
-
20
-
21
-
22
-
23
-
24
-
25
-
26
-
27
-
28
-
29
-
30
-
31
-
32
-
33
-
34
-
35
-
36
-
37
-
38
-
39
-
40
-
41
-
42
-
43
-
44
-
45
-
46
-
47
-
48
-
49
-
50
-
51
-
52
-
53
-
54
-
55
-
56
-
57
-
58
-
59
-
60
-
61
-
62
-
63
-
64
-
65
-
66
-
67
-
68
-
69
-
70
-
71
-
72
-
73
-
74
-
75
-
76
-
77
-
78
-
79
-
80
-
81
-
82
-
83
-
84
-
85
-
86
-
87
-
88
-
89
-
90
-
91
-
92
-
93
-
94
-
95
-
96
-
97
-
98
-
99
-
100
-
101
-
102
-
103
-
104
-
105
-
106
-
107
-
108
-
109
-
110
-
111
-
112
-
113
-
114
-
115
-
116
-
117
-
118
-
119
-
120
-
121
-
122
-
123
-
124
-
125
-
126
-
127
-
128
-
129
-
130
-
131
-
132
-
133
-
134
-
135
-
136
-
137
-
138
-
139
-
140
-
141
-
142
-
143
-
144
-
145
-
146
-
147
-
148
-
149
-
150
-
151
-
152
-
153
-
154
-
155
-
156
-
157
-
158
-
159
-
160
-
161
-
162
-
163
-
164
-
165
-
166
-
167
-
168
-
169
-
170
-
171
-
172
-
173
-
174
-
175
-
 176
176 -
 177
177 -
 178
178 -
 179
179 -
 180
180 -
 181
181 -
 182
182 -
 183
183 -
 184
184 -
 185
185 -
 186
186 -
 187
187 -
 188
188 -
 189
189 -
 190
190 -
 191
191 -
 192
192 -
 193
193 -
 194
194 -
 195
195 -
 196
196 -
197
-
198
-
199
-
200
-
201
-
202
-
203
-
204
-
205
-
206
-
207
-
208
-
209
-
210
-
211
-
212
-
213
-
214
-
215
-
216
-
217
-
218
-
219
-
220
-
221
-
222
-
223
-
224
-
225
-
226
-
227
-
228
-
229
-
230
-
231
-
232
-
233
-
234
 |
 |
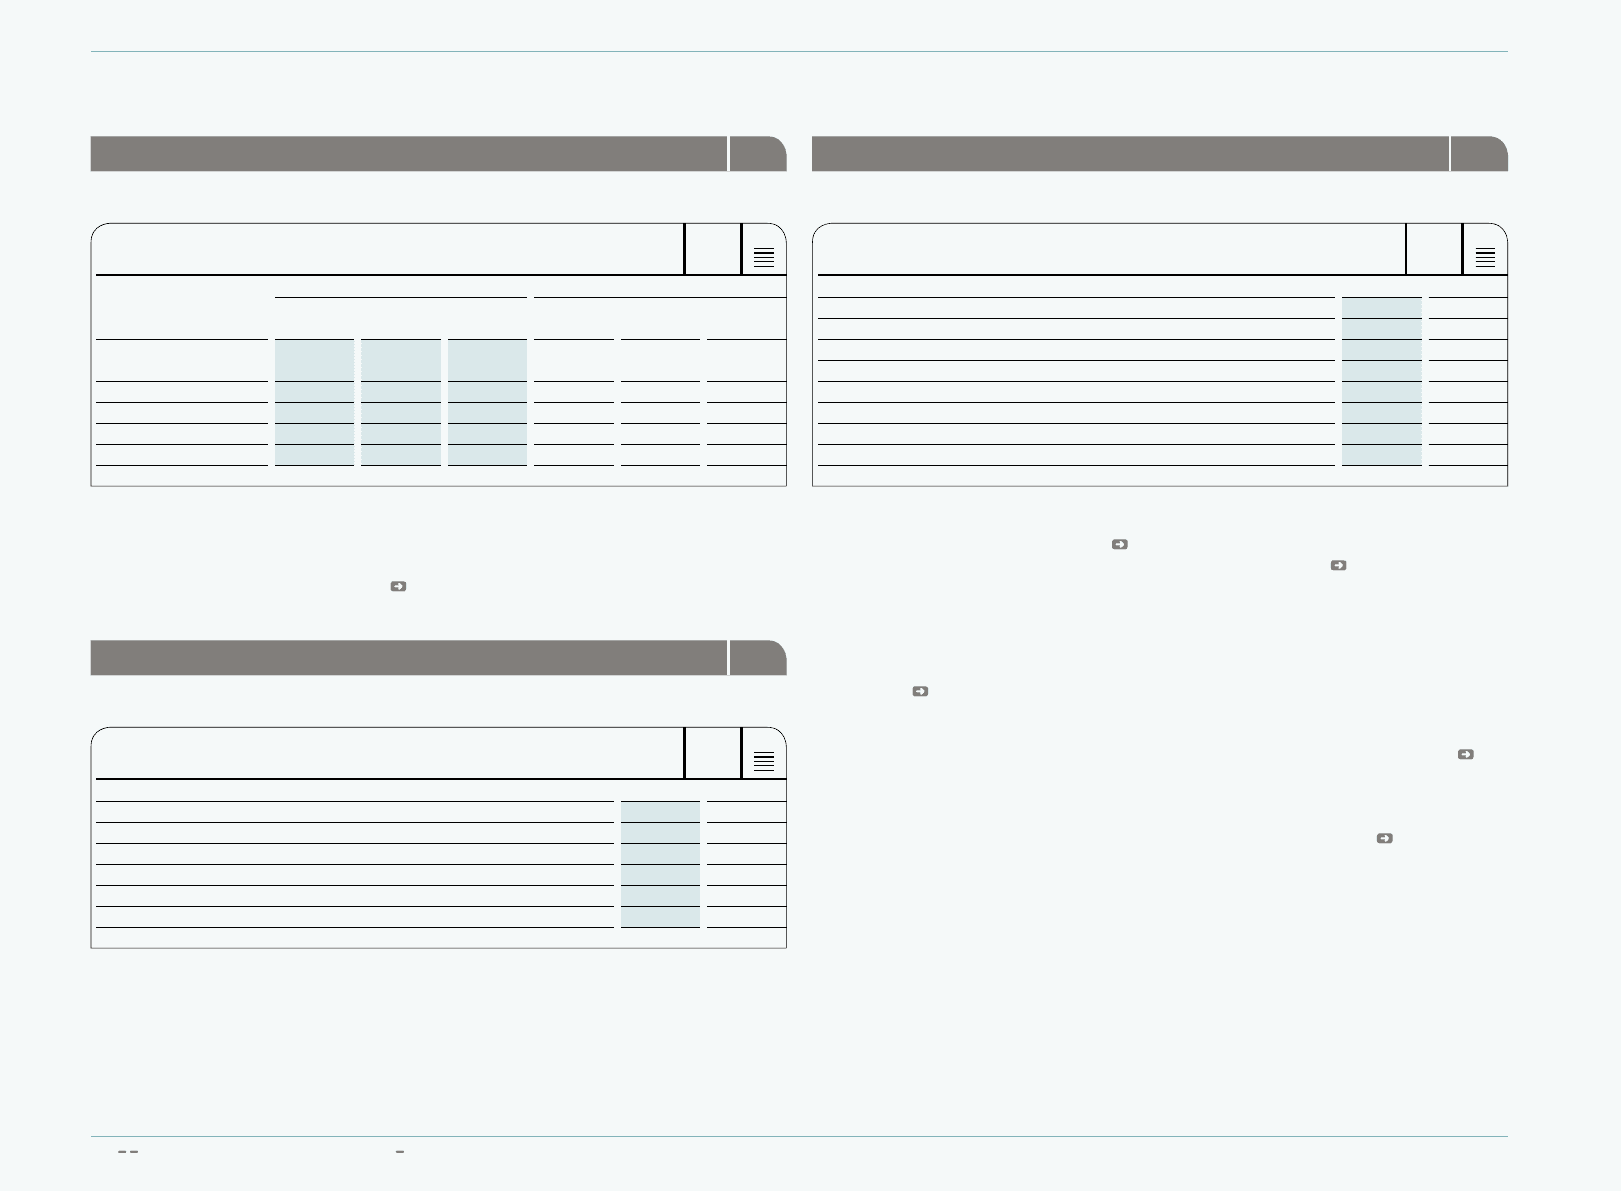
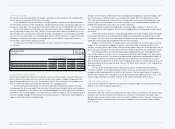
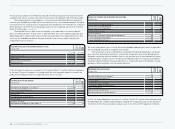
182 CONSOLIDATED FINANCIAL STATEMENTS Notes
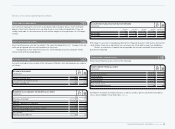
Inventories 09
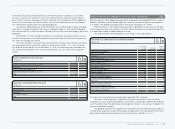
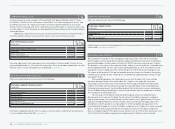
Inventories by major classification are as follows:
N
°-
09
INVENTORIES
€ IN MILLIONS
Dec. 31, 2009 Dec. 31, 2008
Gross
value Allowance for
obsolescence Net
value Gross
value Allowance for
obsolescence Net
value
Finished goods and
merchandise on hand 1,197 73 1,124 1,463 82 1,381
Goods in transit 317 — 317 566 — 566
Raw materials 26 2 24 40 2 38
Work in progress 6 — 6 10 — 10
Inventories 1,546 75 1,471 2,079 84 1,995
Goods in transit mainly relate to shipments of finished goods and merchandise from suppliers in
Asia to subsidiaries in Europe, Asia and the Americas. The carrying amount of inventories which
are measured at fair value less cost to sell amounts to € 355 million and € 407 million as at
December 31, 2009 and 2008, respectively see also Note 2.
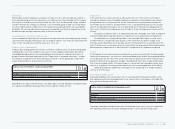
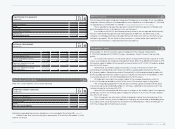
Other current assets 10
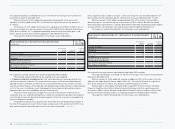
Other current assets consist of the following:
N
°-
1 0
OTHER CURRENT ASSETS
€ IN MILLIONS
Dec. 31, 2009 Dec. 31, 2008
Prepaid expenses 208 292
Tax receivables other than income taxes 84 82
Sundry 72 130
Other current assets, gross 364 504
Less: allowance 4 2
Other current assets, net 360 502
Prepaid expenses relate mainly to promotion agreements and service contracts as well as rents.
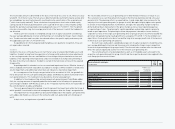
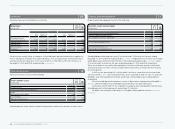
Property, plant and equipment 11
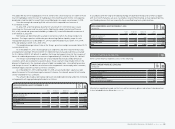
Property, plant and equipment consist of the following:
N
°-
1 1
PROPERTY, PLANT AND EQUIPMENT
€ IN MILLIONS
Dec. 31, 2009 Dec. 31, 2008
Land and buildings/Leasehold improvements 380 489
Technical equipment and machinery 156 140
Other equipment, furniture and fittings 876 847
1,412 1,476
Less: accumulated depreciation 757 656
655 820
Construction in progress, net 68 66
Property, plant and equipment, net 723 886
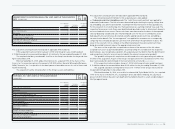
Scheduled depreciation expenses were € 198 million and € 165 million for the years ending
December 31, 2009 and 2008, respectively see also Note 30. Impairment losses which are included
within depreciation and amortisation (shown in other operating expenses see also Note 30) were
€ 16 million and € 6 million for the years ending December 31, 2009 and 2008, respectively.
These are related to assets within other equipment, furniture and fittings, mainly in the Group’s
own-retail activities, for which contrary to expectations there will be an insufficient flow of future
economic benefits.
In 2009, assets amounting to € 2 million and € 0 million in connection with the unrealised
sale of assets see Note 3 were transferred from “assets classified as held-for-sale” to “land and
buildings” and “other equipment, furniture and fittings” within property, plant and equipment,
respectively.
The reclassified depreciation expenses consist of depreciation subsequently reflected see
also Note 3 and the formerly reclassified depreciation which has now been taken back.
Contractual commitments for the acquisition of property, plant and equipment mainly relate
to building projects in Herzogenaurach amounting to € 68 million.
For details see Statement of Movements of Tangible and Intangible Assets Attachment I to
these Notes.