Reebok 2009 Annual Report Download - page 126
Download and view the complete annual report
Please find page 126 of the 2009 Reebok annual report below. You can navigate through the pages in the report by either clicking on the pages listed below, or by using the keyword search tool below to find specific information within the annual report.-
 1
1 -
2
-
3
-
4
-
5
-
6
-
7
-
8
-
9
-
10
-
11
-
12
-
13
-
14
-
15
-
16
-
17
-
18
-
19
-
20
-
21
-
22
-
23
-
24
-
25
-
26
-
27
-
28
-
29
-
30
-
31
-
32
-
33
-
34
-
35
-
36
-
37
-
38
-
39
-
40
-
41
-
42
-
43
-
44
-
45
-
46
-
47
-
48
-
49
-
50
-
51
-
52
-
53
-
54
-
55
-
56
-
57
-
58
-
59
-
60
-
61
-
62
-
63
-
64
-
65
-
66
-
67
-
68
-
69
-
70
-
71
-
72
-
73
-
74
-
75
-
76
-
77
-
78
-
79
-
80
-
81
-
82
-
83
-
84
-
85
-
86
-
87
-
88
-
89
-
90
-
91
-
92
-
93
-
94
-
95
-
96
-
97
-
98
-
99
-
100
-
101
-
102
-
103
-
104
-
105
-
106
-
107
-
108
-
109
-
110
-
111
-
112
-
113
-
114
-
115
-
 116
116 -
 117
117 -
 118
118 -
 119
119 -
 120
120 -
 121
121 -
 122
122 -
 123
123 -
 124
124 -
 125
125 -
 126
126 -
 127
127 -
 128
128 -
 129
129 -
 130
130 -
 131
131 -
 132
132 -
 133
133 -
 134
134 -
 135
135 -
 136
136 -
137
-
138
-
139
-
140
-
141
-
142
-
143
-
144
-
145
-
146
-
147
-
148
-
149
-
150
-
151
-
152
-
153
-
154
-
155
-
156
-
157
-
158
-
159
-
160
-
161
-
162
-
163
-
164
-
165
-
166
-
167
-
168
-
169
-
170
-
171
-
172
-
173
-
174
-
175
-
176
-
177
-
178
-
179
-
180
-
181
-
182
-
183
-
184
-
185
-
186
-
187
-
188
-
189
-
190
-
191
-
192
-
193
-
194
-
195
-
196
-
197
-
198
-
199
-
200
-
201
-
202
-
203
-
204
-
205
-
206
-
207
-
208
-
209
-
210
-
211
-
212
-
213
-
214
-
215
-
216
-
217
-
218
-
219
-
220
-
221
-
222
-
223
-
224
-
225
-
226
-
227
-
228
-
229
-
230
-
231
-
232
-
233
-
234
 |
 |
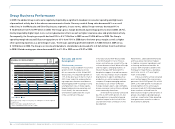
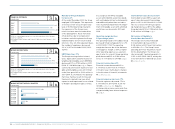
122 GROUP MANAGEMENT REPORT – FINANCIAL REVIEW GROUP BUSINESS PERFORMANCE Balance Sheet and Cash Flow Statement
Balance Sheet and
Cash Flow Statement
Changes in accounting policy
The Group’s consolidated financial
statements are prepared in accordance
with International Financial Reporting
Standards (IFRS as adopted by the EU).
In 2009, there were relevant changes in
IFRS which were reflected in the Group’s
consolidation and accounting principles
see Note 1, p. 170. However, the impact
on the Group’s consolidated financial
statements from any such changes was
not material in the reporting period.
Total assets decrease 7%
At the end of 2009, total assets decreased
7% to € 8.875 billion versus € 9.533 bil-
lion in the prior year. This was primarily
attributable to a decrease in current
assets. A decrease in non-current
assets also impacted this development
see 37.
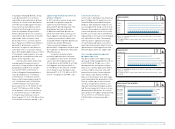
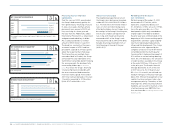
Group inventories down 26%
Group inventories decreased 26% to
€ 1.471 billion at the end of 2009 versus
€ 1.995 billion in 2008 see Note 9, p. 182.
On a currency-neutral basis, inventories
declined 27%. This was mainly a result of
reduced production volumes as well as
clearance of excess inventories at all our
brands see 38.
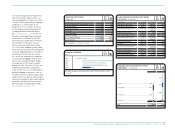
Accounts receivable decrease 12%
At the end of 2009, Group receivables
decreased 12% to € 1.429 billion (2008:
€ 1.624 billion) see Note 7, p. 181. On a
currency-neutral basis, receivables were
down 13%. This decrease reflects strict
discipline in implementing the Group’s
trade terms and improved collection of
receivables as the difficult economic situ-
ation eased in most markets at year-end
see 39.
Other current financial assets
down 44%
Other current financial assets decreased
44% to € 160 million at the end of 2009
from € 287 million in 2008 see Note 8,
p. 181. This development was mainly
due to the decrease of the fair value of
current forward contracts.
Other current assets down 28%
Other current assets decreased 28% to
€ 360 million at the end of 2009 from
€ 502 million in 2008, mainly as a result
of a decrease in prepayments see
Note 10, p. 182.
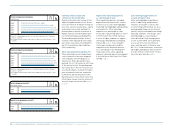
Fixed assets decline 7%
Fixed assets decreased 7% to € 3.794 bil-
lion at the end of 2009 versus € 4.074 bil-
lion in 2008. Additions in an amount of
€ 264 million were mainly related to the
continued expansion of our own-retail
activities and investment into the Group’s
IT infrastructure.
Additions were more than offset by
depreciation and amortisation amounting
to € 310 million, disposals of € 48 million
and a transfer of fixed assets to assets
held-for-sale totalling € 106 million. In
addition, negative currency translation
effects in an amount of € 80 million on
fixed assets denominated in currencies
other than the euro impacted this
development.
Assets held-for-sale increase 296%
At the end of 2009, assets held-for-
sale increased 296% to € 126 million
compared to € 31 million at the end of
2008, due to additional assets now being
in the scope of a sale see Note 3, p. 176.
Assets held-for-sale primarily relate to
the planned sale of land and buildings in
Herzogenaurach, Germany, as well as
certain office buildings and warehouses
in various other locations.
Other non-current assets increase 5%
Other non-current assets increased by
5% to € 126 million at the end of 2009
from € 120 million in 2008, mainly driven
by an increase in prepaid promotion con-
tracts see Note 16, p. 184.
N
°-
35
N
°-
36
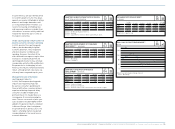
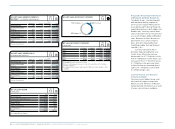
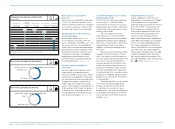
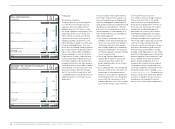
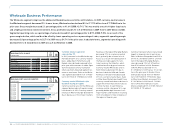
BALANCE SHEET STRUCTURE 1 )
IN % OF TOTAL ASSETS
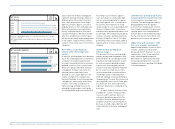
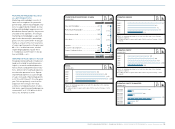
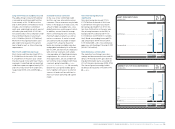
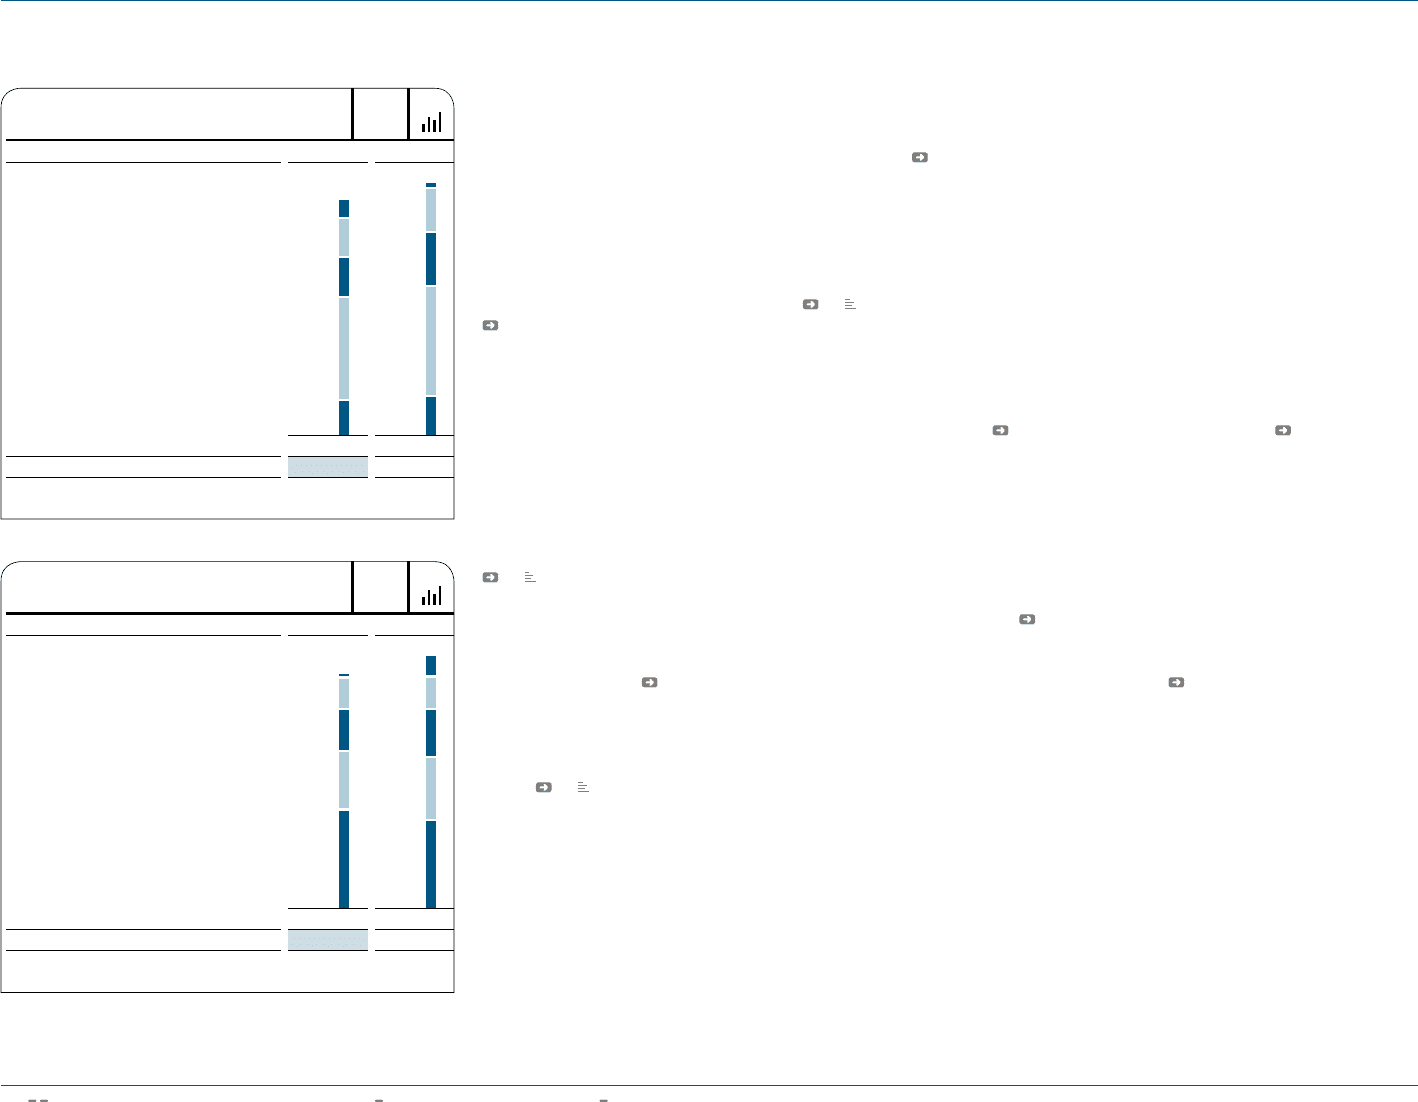
BALANCE SHEET STRUCTURE 1 )
IN % OF TOTAL LIABILITIES AND EQUITY
Assets 2009 2008
Total assets (€ in millions) 8,875 9,533
1) For absolute figures see Consolidated Balance Sheet, p. 166.
Liabilities and equity 2009 2008
Total liabilities and equity (€ in millions) 8,875 9,533
1) For absolute figures see Consolidated Balance Sheet, p. 166.
Cash and cash equivalents ....................................8.7
Short-term borrowings ..........................................2.2
17.0
12.8
2.6
8.4
20.9
18.6
42.7
24.5
16.8
35.7
Fixed assets .........................................................42.8
Other liabilities .....................................................24.5
Accounts receivable .............................................16.1
Accounts payable .................................................13.1
Other assets .........................................................15.8
Total equity ...........................................................42.5
Inventories ...........................................................16.6
Long-term borrowings .........................................17.7