Reebok 2009 Annual Report Download - page 105
Download and view the complete annual report
Please find page 105 of the 2009 Reebok annual report below. You can navigate through the pages in the report by either clicking on the pages listed below, or by using the keyword search tool below to find specific information within the annual report.-
 1
1 -
2
-
3
-
4
-
5
-
6
-
7
-
8
-
9
-
10
-
11
-
12
-
13
-
14
-
15
-
16
-
17
-
18
-
19
-
20
-
21
-
22
-
23
-
24
-
25
-
26
-
27
-
28
-
29
-
30
-
31
-
32
-
33
-
34
-
35
-
36
-
37
-
38
-
39
-
40
-
41
-
42
-
43
-
44
-
45
-
46
-
47
-
48
-
49
-
50
-
51
-
52
-
53
-
54
-
55
-
56
-
57
-
58
-
59
-
60
-
61
-
62
-
63
-
64
-
65
-
66
-
67
-
68
-
69
-
70
-
71
-
72
-
73
-
74
-
75
-
76
-
77
-
78
-
79
-
80
-
81
-
82
-
83
-
84
-
85
-
86
-
87
-
88
-
89
-
90
-
91
-
92
-
93
-
94
-
 95
95 -
 96
96 -
 97
97 -
 98
98 -
 99
99 -
 100
100 -
 101
101 -
 102
102 -
 103
103 -
 104
104 -
 105
105 -
 106
106 -
 107
107 -
 108
108 -
 109
109 -
 110
110 -
 111
111 -
 112
112 -
 113
113 -
 114
114 -
 115
115 -
116
-
117
-
118
-
119
-
120
-
121
-
122
-
123
-
124
-
125
-
126
-
127
-
128
-
129
-
130
-
131
-
132
-
133
-
134
-
135
-
136
-
137
-
138
-
139
-
140
-
141
-
142
-
143
-
144
-
145
-
146
-
147
-
148
-
149
-
150
-
151
-
152
-
153
-
154
-
155
-
156
-
157
-
158
-
159
-
160
-
161
-
162
-
163
-
164
-
165
-
166
-
167
-
168
-
169
-
170
-
171
-
172
-
173
-
174
-
175
-
176
-
177
-
178
-
179
-
180
-
181
-
182
-
183
-
184
-
185
-
186
-
187
-
188
-
189
-
190
-
191
-
192
-
193
-
194
-
195
-
196
-
197
-
198
-
199
-
200
-
201
-
202
-
203
-
204
-
205
-
206
-
207
-
208
-
209
-
210
-
211
-
212
-
213
-
214
-
215
-
216
-
217
-
218
-
219
-
220
-
221
-
222
-
223
-
224
-
225
-
226
-
227
-
228
-
229
-
230
-
231
-
232
-
233
-
234
 |
 |

GROUP MANAGEMENT REPORT – OUR GROUP OUR GROUP Employees 101
Global employee base
continues to grow
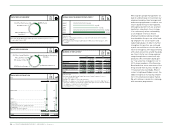
On December 31, 2009, the Group had
39,596 employees, which represents an
increase of 2% versus 38,982 in the previ-
ous year. This development is primarily
related to new employees in the Retail
segment, mainly on a part-time basis. On
a full-time equivalent basis, our Group
had 34,437 employees on December
31, 2009 (2008: 35,977). Due to the high
share of employees working on a part-
time basis in the Retail segment, this
figure is lower than the figure reported
on a headcount basis see 07.
Personnel expenses increased 5%
to € 1.352 billion in 2009 from € 1.283
billion in 2008 see Note 31, p. 201, repre-
senting 31% of the Group’s total operat-
ing expenses (2008: 30%) and 13% of
Group sales (2008: 12%).
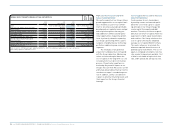
Emerging markets and own retail
drive employee growth
The number of employees working in
the Wholesale segment decreased 8%
to 4,881 at the end of 2009 (2008: 5,303),
mainly due to the effects of reorgani sation
initiatives and the implementation of a
hiring freeze for all non-retail-related
functions. Staff in our Retail segment
increased 11% due to the expansion of
own-retail activities in emerging markets.
Hence, the Retail segment comprised
19,599 employees at year-end (2008:
17,614). In Other Businesses, the number
of employees decreased by 7% to 1,569
(2008: 1,694), primarily due to the effects
of reorganisation initiatives as well as the
implementation of a hiring freeze for all
non-retail-related functions. The number
of employees working in our head quarter
functions decreased by 6% to 13,547
(2008: 14,370). This development reflects
the implementation of a hiring freeze for
all non-retail-related functions in 2009.
At the end of 2009, 23% of our Group’s
staff were employed in Western Europe
(2008: 24%), 31% in European Emerging
Markets (2008: 28%), 25% in North
America (2008: 28%), 8% in Greater China
(2008: 9%), 6% in Other Asian Markets
(2008: 6%) and 7% in Latin America
(2008: 6%). As a global company with
less than 10% of our employees located
in Germany, we actively encourage
global mobility and offer our employees
the opportunity to go on international
assignments. To support relocating
professionals and their families in new
living and working environments, we
provide, for example, relevant language
and cultural training.
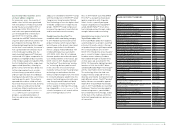
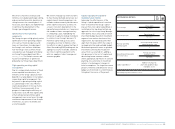
N
°-
08
KEY EMPLOYEE STATISTICS 2009
Total number of employees 39,596
Total employees (in %)
Male 50%
Female 50%
Management positions (in %)
Male 69%
Female 31%
Average age of employees (in years) 1 ) 31
Average length of service (in years) 4
Annual training hours by employee (in hours) 7
1) At year-end.