Reebok 2009 Annual Report Download - page 189
Download and view the complete annual report
Please find page 189 of the 2009 Reebok annual report below. You can navigate through the pages in the report by either clicking on the pages listed below, or by using the keyword search tool below to find specific information within the annual report.-
 1
1 -
2
-
3
-
4
-
5
-
6
-
7
-
8
-
9
-
10
-
11
-
12
-
13
-
14
-
15
-
16
-
17
-
18
-
19
-
20
-
21
-
22
-
23
-
24
-
25
-
26
-
27
-
28
-
29
-
30
-
31
-
32
-
33
-
34
-
35
-
36
-
37
-
38
-
39
-
40
-
41
-
42
-
43
-
44
-
45
-
46
-
47
-
48
-
49
-
50
-
51
-
52
-
53
-
54
-
55
-
56
-
57
-
58
-
59
-
60
-
61
-
62
-
63
-
64
-
65
-
66
-
67
-
68
-
69
-
70
-
71
-
72
-
73
-
74
-
75
-
76
-
77
-
78
-
79
-
80
-
81
-
82
-
83
-
84
-
85
-
86
-
87
-
88
-
89
-
90
-
91
-
92
-
93
-
94
-
95
-
96
-
97
-
98
-
99
-
100
-
101
-
102
-
103
-
104
-
105
-
106
-
107
-
108
-
109
-
110
-
111
-
112
-
113
-
114
-
115
-
116
-
117
-
118
-
119
-
120
-
121
-
122
-
123
-
124
-
125
-
126
-
127
-
128
-
129
-
130
-
131
-
132
-
133
-
134
-
135
-
136
-
137
-
138
-
139
-
140
-
141
-
142
-
143
-
144
-
145
-
146
-
147
-
148
-
149
-
150
-
151
-
152
-
153
-
154
-
155
-
156
-
157
-
158
-
159
-
160
-
161
-
162
-
163
-
164
-
165
-
166
-
167
-
168
-
169
-
170
-
171
-
172
-
173
-
174
-
175
-
176
-
177
-
178
-
 179
179 -
 180
180 -
 181
181 -
 182
182 -
 183
183 -
 184
184 -
 185
185 -
 186
186 -
 187
187 -
 188
188 -
 189
189 -
 190
190 -
 191
191 -
 192
192 -
 193
193 -
 194
194 -
 195
195 -
 196
196 -
 197
197 -
 198
198 -
 199
199 -
200
-
201
-
202
-
203
-
204
-
205
-
206
-
207
-
208
-
209
-
210
-
211
-
212
-
213
-
214
-
215
-
216
-
217
-
218
-
219
-
220
-
221
-
222
-
223
-
224
-
225
-
226
-
227
-
228
-
229
-
230
-
231
-
232
-
233
-
234
 |
 |
CONSOLIDATED FINANCIAL STATEMENTS Notes 185
The adidas AG share first traded above 110% (€ 28.05) of the conversion price of € 25.50 on more
than 20 trading days within the last 30 trading days in the fourth quarter of 2004. Consequently,
bondholders had the right to convert their convertible bonds into equity since January 1, 2005.
Gross borrowings decreased by € 806 million in 2009 compared to an increase of
€ 427 million in 2008.
In June 2009, a German private placement in an amount of € 200 million was issued,
consisting of a three-year and five-year tranche. Additionally, adidas International Finance
B.V., a fully owned and guaranteed subsidiary of adidas AG, issued a Eurobond in an amount of
€ 500 million in July 2009.
Borrowings are denominated in a variety of currencies in which the Group conducts its
business. The largest portions of effective gross borrowings (before liquidity swaps for cash
management purposes) as at December 31, 2009 are denominated in euros (2009: 61%; 2008:
57%) and US dollars (2009: 33%; 2008: 39%).
The weighted average interest rate on the Group’s gross borrowings remained stable at 5.2%
in 2009 (2008: 5.2%).
As at December 31, 2009, the Group had cash credit lines and other long-term financing
arrangements totalling € 5.9 billion (2008: € 6.5 billion); thereof unused credit lines accounted
for € 4.1 billion (2008: € 4.0 billion). In addition, the Group had separate lines for the issuance of
letters of credit and guarantees in an amount of approximately € 0.4 billion (2008: € 0.3 billion).
The Group’s outstanding financings are unsecured and may include standard financial
covenants, which are reviewed on a quarterly basis. These covenants may include limits on the
disposal of fixed assets, the maximum amount of debt secured by liens, cross default provisions
and change of control. In addition, certain financial arrangements contain equity ratio covenants,
minimum equity covenants as well as net loss covenants.
As of December 31, 2009, and December 31, 2008, actual shareholders’ equity was well
above the amount of the minimum equity covenant. Likewise, the relevant amount of net income
clearly exceeded net loss covenants.
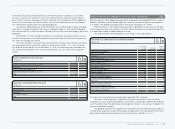
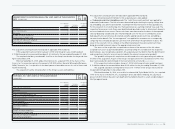
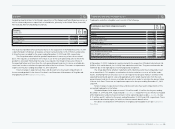
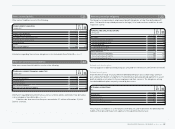
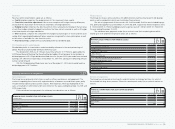
The amounts disclosed as borrowings represent outstanding borrowings under the following
arrangements with aggregated expiration dates as follows:
N
°-
1 7
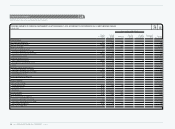
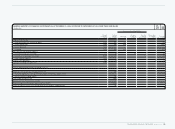
GROSS BORROWINGS AS AT DECEMBER 31, 2009
€ IN MILLIONS
Up to
1 year Between 1
and 3 years Between 3
and 5 years After
5 years Total
Bank borrowings incl.
commercial paper — 103 — — 103
Private placements 198 458 324 186 1,166
Eurobond — — 498 — 498
Convertible bond — — — — —
Total 198 561 822 186 1,767
In accordance with the long-term funding strategy, the bank borrowings and commercial paper
with short-term maturities are also classified as long-term borrowings as they represent perma-
nent funding volumes that are covered by the committed long-term syndicated loan.
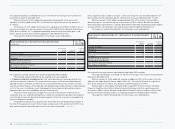
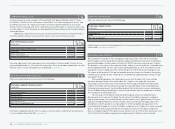
N
°-
1 7
GROSS BORROWINGS AS AT DECEMBER 31, 2008
€ IN MILLIONS
Up to
1 year Between 1
and 3 years Between 3
and 5 years After
5 years Total
Bank borrowings incl.
commercial paper — — 748 — 748
Private placements 404 462 332 234 1,432
Convertible bond 393 — — — 393
Total 797 462 1,080 234 2,573
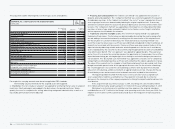
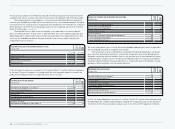
Other current financial liabilities 18
Other current financial liabilities consist of the following:
N
°-
1 8
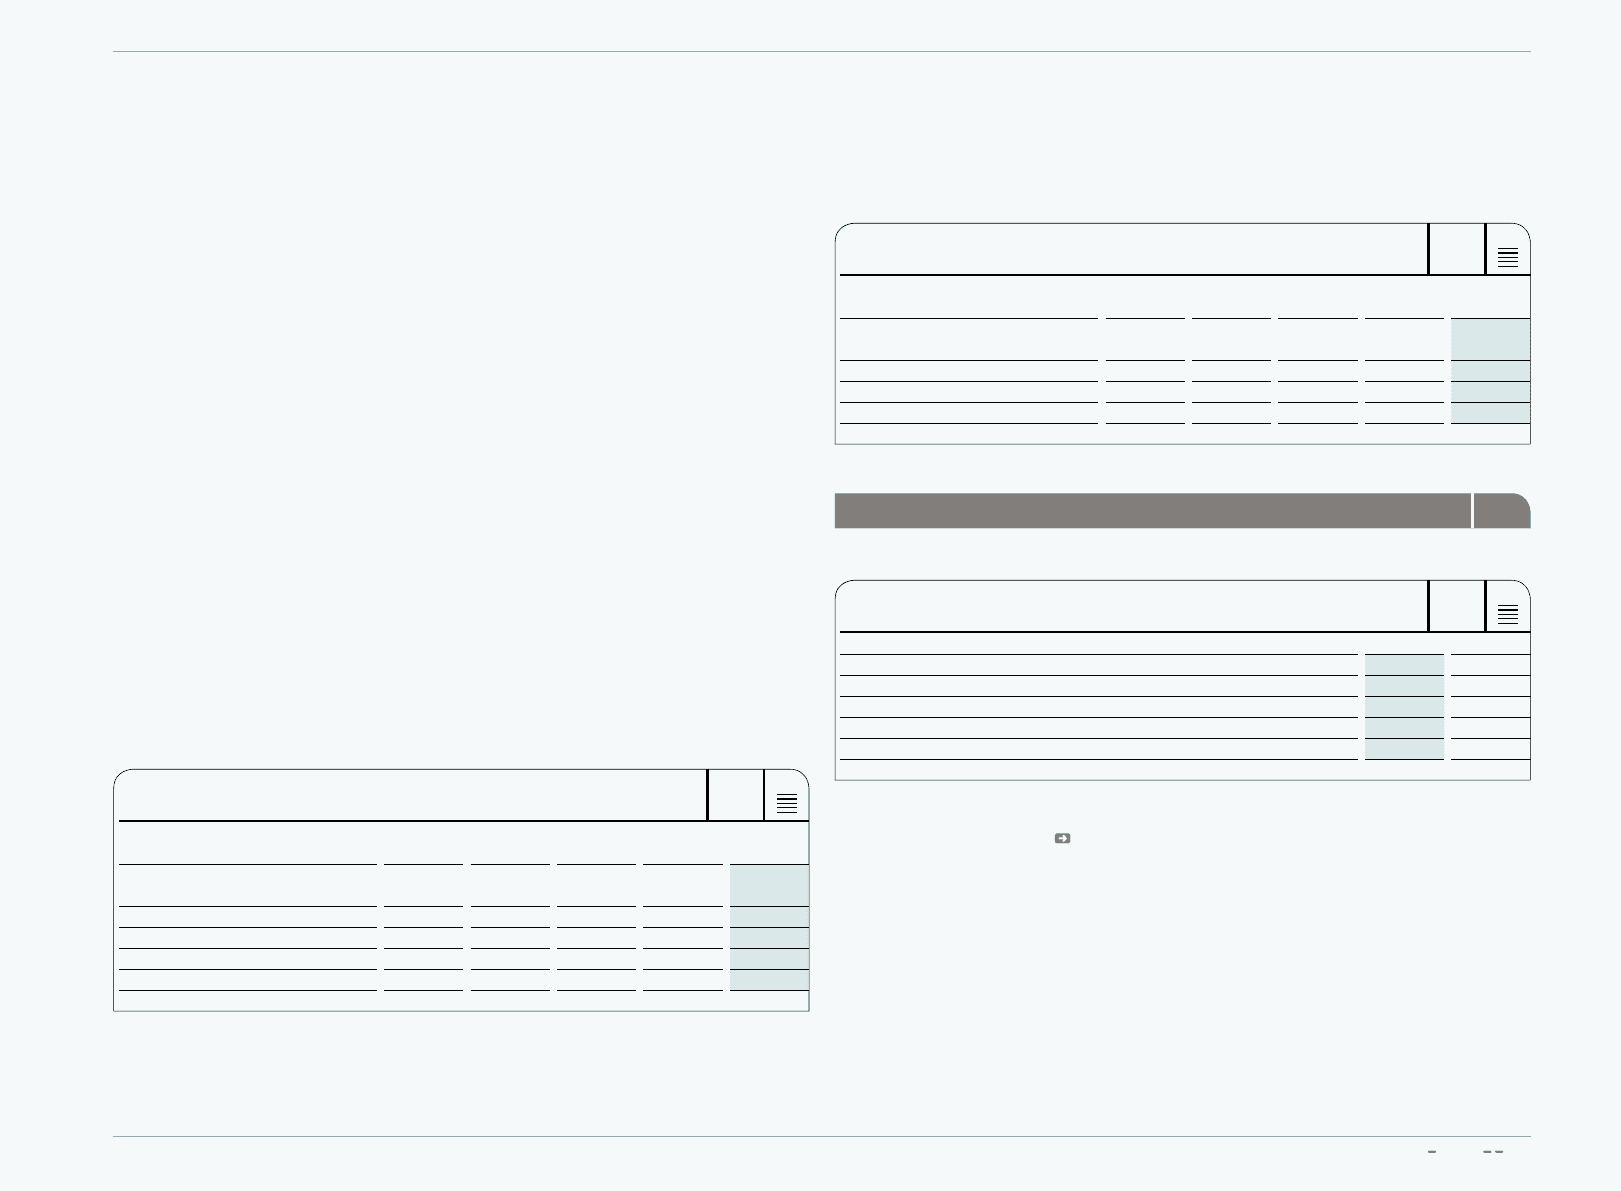
OTHER CURRENT FINANCIAL LIABILITIES
€ IN MILLIONS
Dec. 31, 2009 Dec. 31, 2008
Interest rate derivatives 2 —
Currency options 10 15
Forward contracts 69 42
Other financial liabilities 20 22
Other current financial liabilities 101 79
Information regarding forward contracts as well as currency options and interest rate derivatives
is also included in these Notes see Note 28.