Reebok 2009 Annual Report Download - page 154
Download and view the complete annual report
Please find page 154 of the 2009 Reebok annual report below. You can navigate through the pages in the report by either clicking on the pages listed below, or by using the keyword search tool below to find specific information within the annual report.-
 1
1 -
2
-
3
-
4
-
5
-
6
-
7
-
8
-
9
-
10
-
11
-
12
-
13
-
14
-
15
-
16
-
17
-
18
-
19
-
20
-
21
-
22
-
23
-
24
-
25
-
26
-
27
-
28
-
29
-
30
-
31
-
32
-
33
-
34
-
35
-
36
-
37
-
38
-
39
-
40
-
41
-
42
-
43
-
44
-
45
-
46
-
47
-
48
-
49
-
50
-
51
-
52
-
53
-
54
-
55
-
56
-
57
-
58
-
59
-
60
-
61
-
62
-
63
-
64
-
65
-
66
-
67
-
68
-
69
-
70
-
71
-
72
-
73
-
74
-
75
-
76
-
77
-
78
-
79
-
80
-
81
-
82
-
83
-
84
-
85
-
86
-
87
-
88
-
89
-
90
-
91
-
92
-
93
-
94
-
95
-
96
-
97
-
98
-
99
-
100
-
101
-
102
-
103
-
104
-
105
-
106
-
107
-
108
-
109
-
110
-
111
-
112
-
113
-
114
-
115
-
116
-
117
-
118
-
119
-
120
-
121
-
122
-
123
-
124
-
125
-
126
-
127
-
128
-
129
-
130
-
131
-
132
-
133
-
134
-
135
-
136
-
137
-
138
-
139
-
140
-
141
-
142
-
143
-
 144
144 -
 145
145 -
 146
146 -
 147
147 -
 148
148 -
 149
149 -
 150
150 -
 151
151 -
 152
152 -
 153
153 -
 154
154 -
 155
155 -
 156
156 -
 157
157 -
 158
158 -
 159
159 -
 160
160 -
 161
161 -
 162
162 -
 163
163 -
 164
164 -
165
-
166
-
167
-
168
-
169
-
170
-
171
-
172
-
173
-
174
-
175
-
176
-
177
-
178
-
179
-
180
-
181
-
182
-
183
-
184
-
185
-
186
-
187
-
188
-
189
-
190
-
191
-
192
-
193
-
194
-
195
-
196
-
197
-
198
-
199
-
200
-
201
-
202
-
203
-
204
-
205
-
206
-
207
-
208
-
209
-
210
-
211
-
212
-
213
-
214
-
215
-
216
-
217
-
218
-
219
-
220
-
221
-
222
-
223
-
224
-
225
-
226
-
227
-
228
-
229
-
230
-
231
-
232
-
233
-
234
 |
 |
150 GROUP MANAGEMENT REPORT – FINANCIAL REVIEW Risk and Opportunity Report
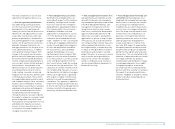
Financing and liquidity risks
Liquidity risks arise from not having the
necessary resources available to meet
maturing liabilities with regard to tim-
ing, volume and currency structure. In
addition, the adidas Group faces the risk
of having to accept unfavourable financ-
ing terms due to liquidity restraints.
Our Group’s Treasury department uses
an efficient cash management system
to manage liquidity risk. At December
31, 2009, Group cash and cash equiva-
lents amounted to € 775 million (2008:
€ 244 million). Moreover, our Group
maintains € 2.2 billion bilateral short-
term credit lines and a € 2 billion com-
mitted medium-term syndicated loan
facility with international banks, which
does not include a market disruption
clause. The € 4.2 billion in credit lines
are designed to ensure sufficient liquidity
at all times. In order to mitigate financing
risks and to reduce the dependence on
bank financing, in 2009 the adidas Group
issued a German private placement in the
amount of € 200 million in two tranches
with a maturity of three and five years
respectively, and a Eurobond in a nominal
amount of € 500 million with a maturity
of five years see Treasury, p. 128.
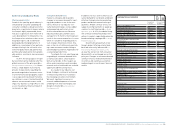
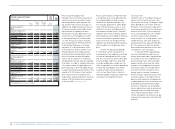
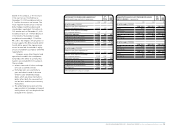
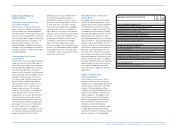
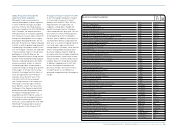
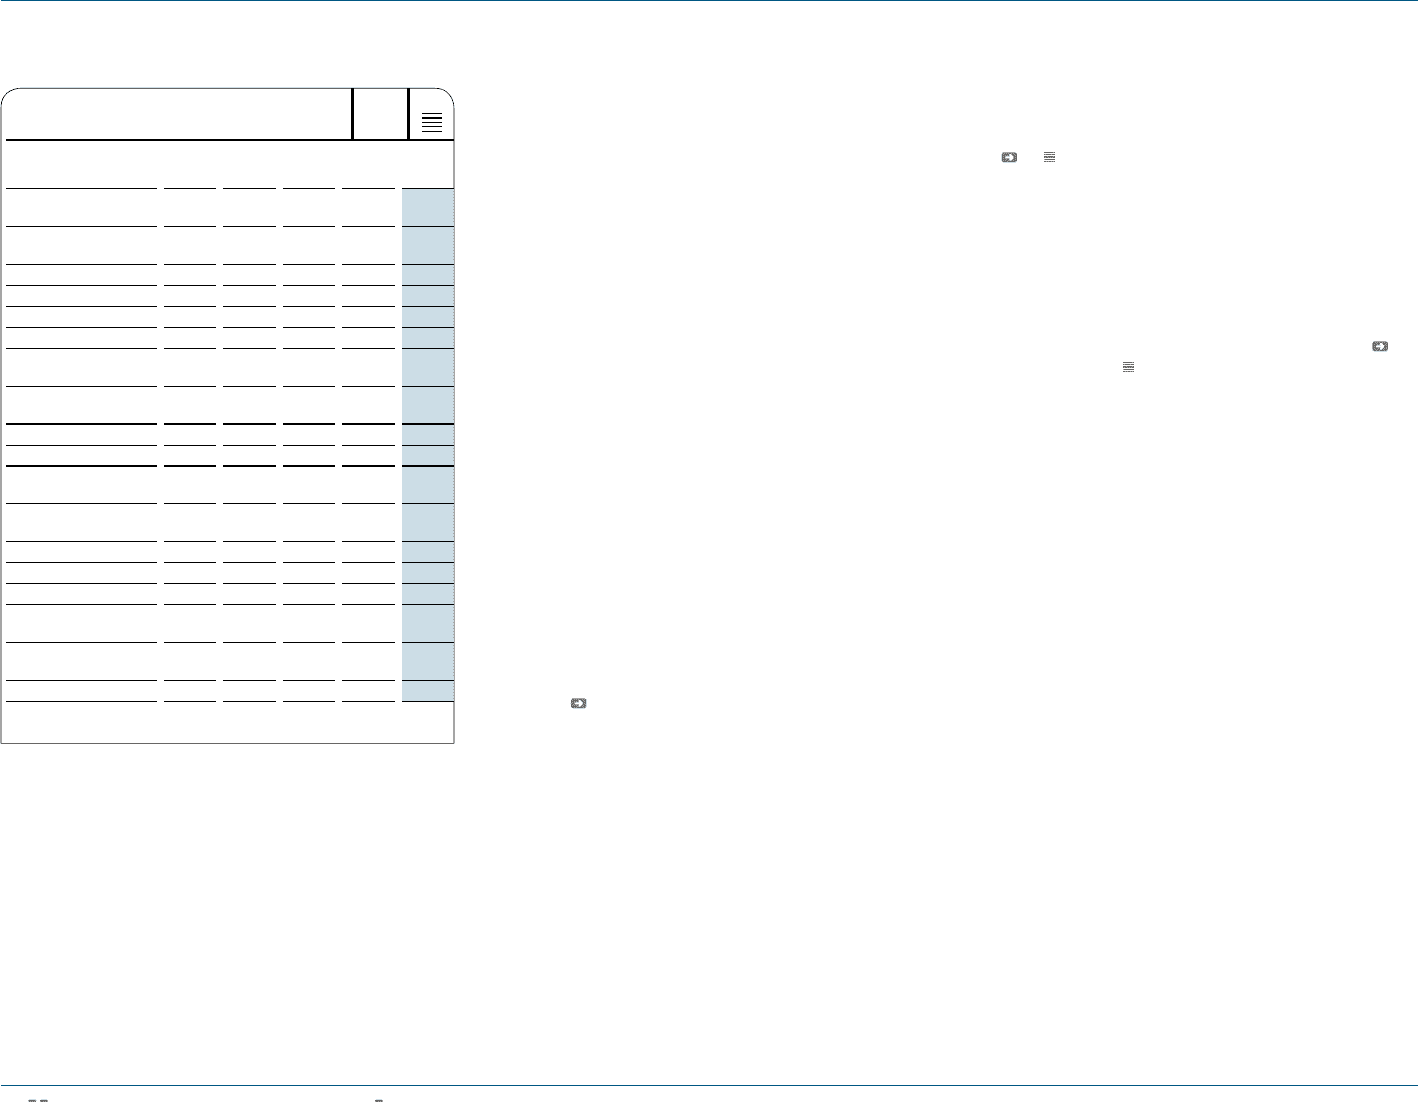
Future cash outflows arising from finan-
cial liabilities that are recognised in the
Consolidated Balance Sheet are pre-
sented in the adjacent table see 03.
This includes payments to settle obliga-
tions from borrowings as well as cash
outflows from cash-settled derivatives
with negative market values. Financial
liabilities that may be settled in advance
without penalty are included on the basis
of the earliest date of potential repay-
ment. Cash flows for variable-interest
liabilities are determined with reference
to the conditions at the balance sheet
date.
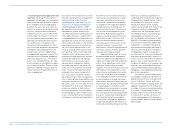
In 2009, we reduced net debt by
€ 1.272 billion, which resulted in the
achievement of our medium-term target
of financial leverage below 50% at year-
end. As a result of this effort and in light
of our available credit lines, financing
structure and business model, we con-
tinue to regard the occurrence probability
of financing and liquidity risks, which
could also lead to increased interest
costs, as low. Nevertheless, failure to
maintain liquidity could have a high finan-
cial impact on Group performance.
Currency risks
Currency risks for the adidas Group are
a direct result of multi-currency cash
flows within the Group. The biggest single
driver behind this risk results from the
mismatch of the currencies required for
sourcing our products versus the denom-
inations of our sales. The vast majority
of our sourcing expenses are in US dol-
lars while sales are denominated in
other currencies to a large extent – most
notably the euro. Our main exposures
are presented in the adjacent table see
04. The exposure from firm commit-
ments and forecasted transactions was
calculated on a one-year basis.
In line with IFRS 7 requirements,
we have estimated the impact on net
income and shareholders’ equity based
on changes in our most important cur-
rency exchange rates. The calculated
impacts mainly result from fair value
changes of our hedging instruments.
The analysis does not include effects
that arise from the translation of our
foreign entities’ financial statements
into the Group’s reporting currency. The
sensitivity analysis is based on the net
balance sheet exposure, including inter-
company balances from monetary assets
and liabilities denominated in foreign
currencies. Moreover, all outstanding
currency derivatives were re-evaluated
using hypothetical foreign exchange
rates to determine the effects on net
income and equity. The analysis was per-
formed on the same basis for both 2008
and 2009.
N
°-
03
FUTURE CASH OUTFLOWS 1 )
€ IN MILLIONS
Up to 1
year
Between
1 and 3
years
Between
3 and 5
years After
5 years Total
As at December 31,
2009
Bank borrowings incl.
commercial paper 103 103
Private placements 245 537 370 201 1,353
Eurobond 24 48 538 610
Convertible bond
Accounts payable 1,166 — — — 1,166
Other financial
liabilities 21 0 1 1 23
Derivative financial
liabilities 81 23 1 1 106
Total 1,640 609 909 203 3,361
As at December 31,
2008
Bank borrowings incl.
commercial paper 748 748
Private placements 462 539 374 261 1,636
Convertible bond 408 408
Accounts payable 1,218 — — — 1,218
Other financial
liabilities 25 1 2 28
Derivative financial
liabilities 57 15 6 2 80
Total 2,918 555 380 265 4,118
1) Rounding differences may arise in totals.