Reebok 2009 Annual Report Download - page 225
Download and view the complete annual report
Please find page 225 of the 2009 Reebok annual report below. You can navigate through the pages in the report by either clicking on the pages listed below, or by using the keyword search tool below to find specific information within the annual report.-
 1
1 -
2
-
3
-
4
-
5
-
6
-
7
-
8
-
9
-
10
-
11
-
12
-
13
-
14
-
15
-
16
-
17
-
18
-
19
-
20
-
21
-
22
-
23
-
24
-
25
-
26
-
27
-
28
-
29
-
30
-
31
-
32
-
33
-
34
-
35
-
36
-
37
-
38
-
39
-
40
-
41
-
42
-
43
-
44
-
45
-
46
-
47
-
48
-
49
-
50
-
51
-
52
-
53
-
54
-
55
-
56
-
57
-
58
-
59
-
60
-
61
-
62
-
63
-
64
-
65
-
66
-
67
-
68
-
69
-
70
-
71
-
72
-
73
-
74
-
75
-
76
-
77
-
78
-
79
-
80
-
81
-
82
-
83
-
84
-
85
-
86
-
87
-
88
-
89
-
90
-
91
-
92
-
93
-
94
-
95
-
96
-
97
-
98
-
99
-
100
-
101
-
102
-
103
-
104
-
105
-
106
-
107
-
108
-
109
-
110
-
111
-
112
-
113
-
114
-
115
-
116
-
117
-
118
-
119
-
120
-
121
-
122
-
123
-
124
-
125
-
126
-
127
-
128
-
129
-
130
-
131
-
132
-
133
-
134
-
135
-
136
-
137
-
138
-
139
-
140
-
141
-
142
-
143
-
144
-
145
-
146
-
147
-
148
-
149
-
150
-
151
-
152
-
153
-
154
-
155
-
156
-
157
-
158
-
159
-
160
-
161
-
162
-
163
-
164
-
165
-
166
-
167
-
168
-
169
-
170
-
171
-
172
-
173
-
174
-
175
-
176
-
177
-
178
-
179
-
180
-
181
-
182
-
183
-
184
-
185
-
186
-
187
-
188
-
189
-
190
-
191
-
192
-
193
-
194
-
195
-
196
-
197
-
198
-
199
-
200
-
201
-
202
-
203
-
204
-
205
-
206
-
207
-
208
-
209
-
210
-
211
-
212
-
213
-
214
-
 215
215 -
 216
216 -
 217
217 -
 218
218 -
 219
219 -
 220
220 -
 221
221 -
 222
222 -
 223
223 -
 224
224 -
 225
225 -
 226
226 -
 227
227 -
 228
228 -
 229
229 -
 230
230 -
 231
231 -
 232
232 -
 233
233 -
 234
234
 |
 |
ADDITIONAL INFORMATION Ten-Year Overview 221
N
°-
01
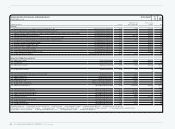
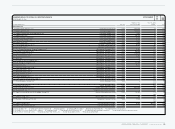
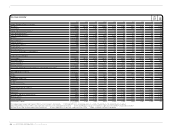
TEN-YEAR OVERVIEW
2009 2008 2007 2006 1 ) 2005 2004 2003 2002 2001 2000
Balance Sheet Ratios
Net borrowings/EBITDA 2 ) 1.2 1.7 1.5 2.1 (0.7) 0.9 1.6 2.4 2.7 3.1
Financial leverage 4) 24.3% 64.6% 58.4% 78.9% (20.5%) 43.1% 79.2% 138.5% 165.5% 219.6%
Equity ratio 4) 42.5% 35.5% 36.3% 33.8% 46.7% 34.8% 30.7% 25.4% 24.3% 20.3%
Equity-to-fixed-assets ratio 4) 85.9% 73.6% 72.2% 63.5% 194.0% 110.4% 91.1% 75.4% 77.8% 66.2%
Asset coverage I 4) 137.4% 127.7% 136.1% 138.7% 284.1% 194.1% 197.6% 196.9% 209.3% 207.7%
Asset coverage II 4) 102.9% 89.1% 98.0% 102.0% 150.4% 106.3% 108.3% 107.6% 105.9% 101.3%
Fixed asset intensity of investments 49.5% 48.2% 50.3% 53.2% 24.1% 31.6% 33.7% 33.7% 31.2% 30.7%
Current asset intensity of investments 50.5% 51.8% 49.7% 46.8% 75.9% 68.4% 66.3% 66.3% 68.8% 69.3%
Liquidity I 4) 30.0% 10.5% 14.5% 15.8% 92.0% 26.8% 20.8% 5.5% 6.1% 7.7%
Liquidity II 4) 80.4% 55.1% 70.3% 80.4% 148.0% 88.4% 100.8% 99.1% 96.0% 90.4%
Liquidity III 4) 132.2% 109.8% 132.6% 153.7% 219.4% 156.4% 187.4% 185.3% 187.4% 185.0%
Working capital turnover 4) 6.3 8.4 6.8 5.8 2.6 4.4 4.4 4.5 4.1 4.1
Return on equity 4) 5) 6.5% 18.9% 18.2% 17.1% 14.3% 20.4% 20.2% 21.1% 20.5% 22.3%
Return on capital employed 4) 5) 11.3% 19.8% 20.2% 17.6% 49.3% 27.5% 22.1% 16.8% 16.7% 17.0%
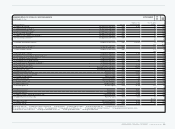
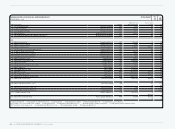
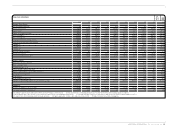
Data Per Share 6 )
Share price at year-end (in €) 37.77 27.14 51.26 37.73 40.00 29.69 22.58 20.58 21.08 16.50
Basic earnings 5 ) (in €) 1.25 3.25 2.71 2.37 2.05 1.72 1.43 1.26 1.15 1.00
Diluted earnings 5 ) (in €) 1.22 3.07 2.57 2.25 1.93 1.64 1.43 1.26 1.15 1.00
Price/earnings ratio at year-end 31.0 8.8 19.9 16.8 20.7 18.1 15.8 16.3 18.3 16.5
Market capitalisation at year-end (€ in millions) 7,902 5,252 10,438 7,679 8,122 5,446 4,104 3,738 3,823 2,993
Operating cash flow (in €) 6.11 2.52 3.83 3.74 1.88 3.17 3.58 2.94 2.12 (0.06)
Dividend (in €) 0.35 7 ) 0.50 0.50 0.42 0.33 0.33 0.25 0.25 0.23 0.23
Dividend payout ratio (in %) 29.8 15.1 18.0 17.7 17.2 18.9 17.5 19.8 20.0 22.9
Number of outstanding shares at year-end (in thousands) 209,216 193,516 203,629 203,537 203,047 183,436 181,816 181,692 181,396 181,396
Employees
Number of employees at year-end 2 ) 39,596 38,982 31,344 26,376 15,935 14,254 15,686 14,716 13,941 13,362
Personnel expenses 2 ) (€ in millions) 1,352 1,283 1,186 1,087 706 637 709 758 695 630
1) Including Reebok, Rockport and Reebok-CCM Hockey from February 1, 2006 onwards. 2) 2004 and 2005 reflect continuing operations as a result of the divestiture of the Salomon business segment.
3) Operating profit figures prior to 2004 exclude royalty and commission income and goodwill amortisation. 4) 2003 and 2004 figures have been restated due to application of IAS 32/IAS 39 and amendment to IAS 19.
5) Includes income from continuing and discontinued operations. 6) Figures adjusted for 1:4 share split conducted on June 6, 2006. 7) Subject to Annual General Meeting approval.