Reebok 2009 Annual Report Download - page 205
Download and view the complete annual report
Please find page 205 of the 2009 Reebok annual report below. You can navigate through the pages in the report by either clicking on the pages listed below, or by using the keyword search tool below to find specific information within the annual report.-
 1
1 -
2
-
3
-
4
-
5
-
6
-
7
-
8
-
9
-
10
-
11
-
12
-
13
-
14
-
15
-
16
-
17
-
18
-
19
-
20
-
21
-
22
-
23
-
24
-
25
-
26
-
27
-
28
-
29
-
30
-
31
-
32
-
33
-
34
-
35
-
36
-
37
-
38
-
39
-
40
-
41
-
42
-
43
-
44
-
45
-
46
-
47
-
48
-
49
-
50
-
51
-
52
-
53
-
54
-
55
-
56
-
57
-
58
-
59
-
60
-
61
-
62
-
63
-
64
-
65
-
66
-
67
-
68
-
69
-
70
-
71
-
72
-
73
-
74
-
75
-
76
-
77
-
78
-
79
-
80
-
81
-
82
-
83
-
84
-
85
-
86
-
87
-
88
-
89
-
90
-
91
-
92
-
93
-
94
-
95
-
96
-
97
-
98
-
99
-
100
-
101
-
102
-
103
-
104
-
105
-
106
-
107
-
108
-
109
-
110
-
111
-
112
-
113
-
114
-
115
-
116
-
117
-
118
-
119
-
120
-
121
-
122
-
123
-
124
-
125
-
126
-
127
-
128
-
129
-
130
-
131
-
132
-
133
-
134
-
135
-
136
-
137
-
138
-
139
-
140
-
141
-
142
-
143
-
144
-
145
-
146
-
147
-
148
-
149
-
150
-
151
-
152
-
153
-
154
-
155
-
156
-
157
-
158
-
159
-
160
-
161
-
162
-
163
-
164
-
165
-
166
-
167
-
168
-
169
-
170
-
171
-
172
-
173
-
174
-
175
-
176
-
177
-
178
-
179
-
180
-
181
-
182
-
183
-
184
-
185
-
186
-
187
-
188
-
189
-
190
-
191
-
192
-
193
-
194
-
 195
195 -
 196
196 -
 197
197 -
 198
198 -
 199
199 -
 200
200 -
 201
201 -
 202
202 -
 203
203 -
 204
204 -
 205
205 -
 206
206 -
 207
207 -
 208
208 -
 209
209 -
 210
210 -
 211
211 -
 212
212 -
 213
213 -
 214
214 -
 215
215 -
216
-
217
-
218
-
219
-
220
-
221
-
222
-
223
-
224
-
225
-
226
-
227
-
228
-
229
-
230
-
231
-
232
-
233
-
234
 |
 |
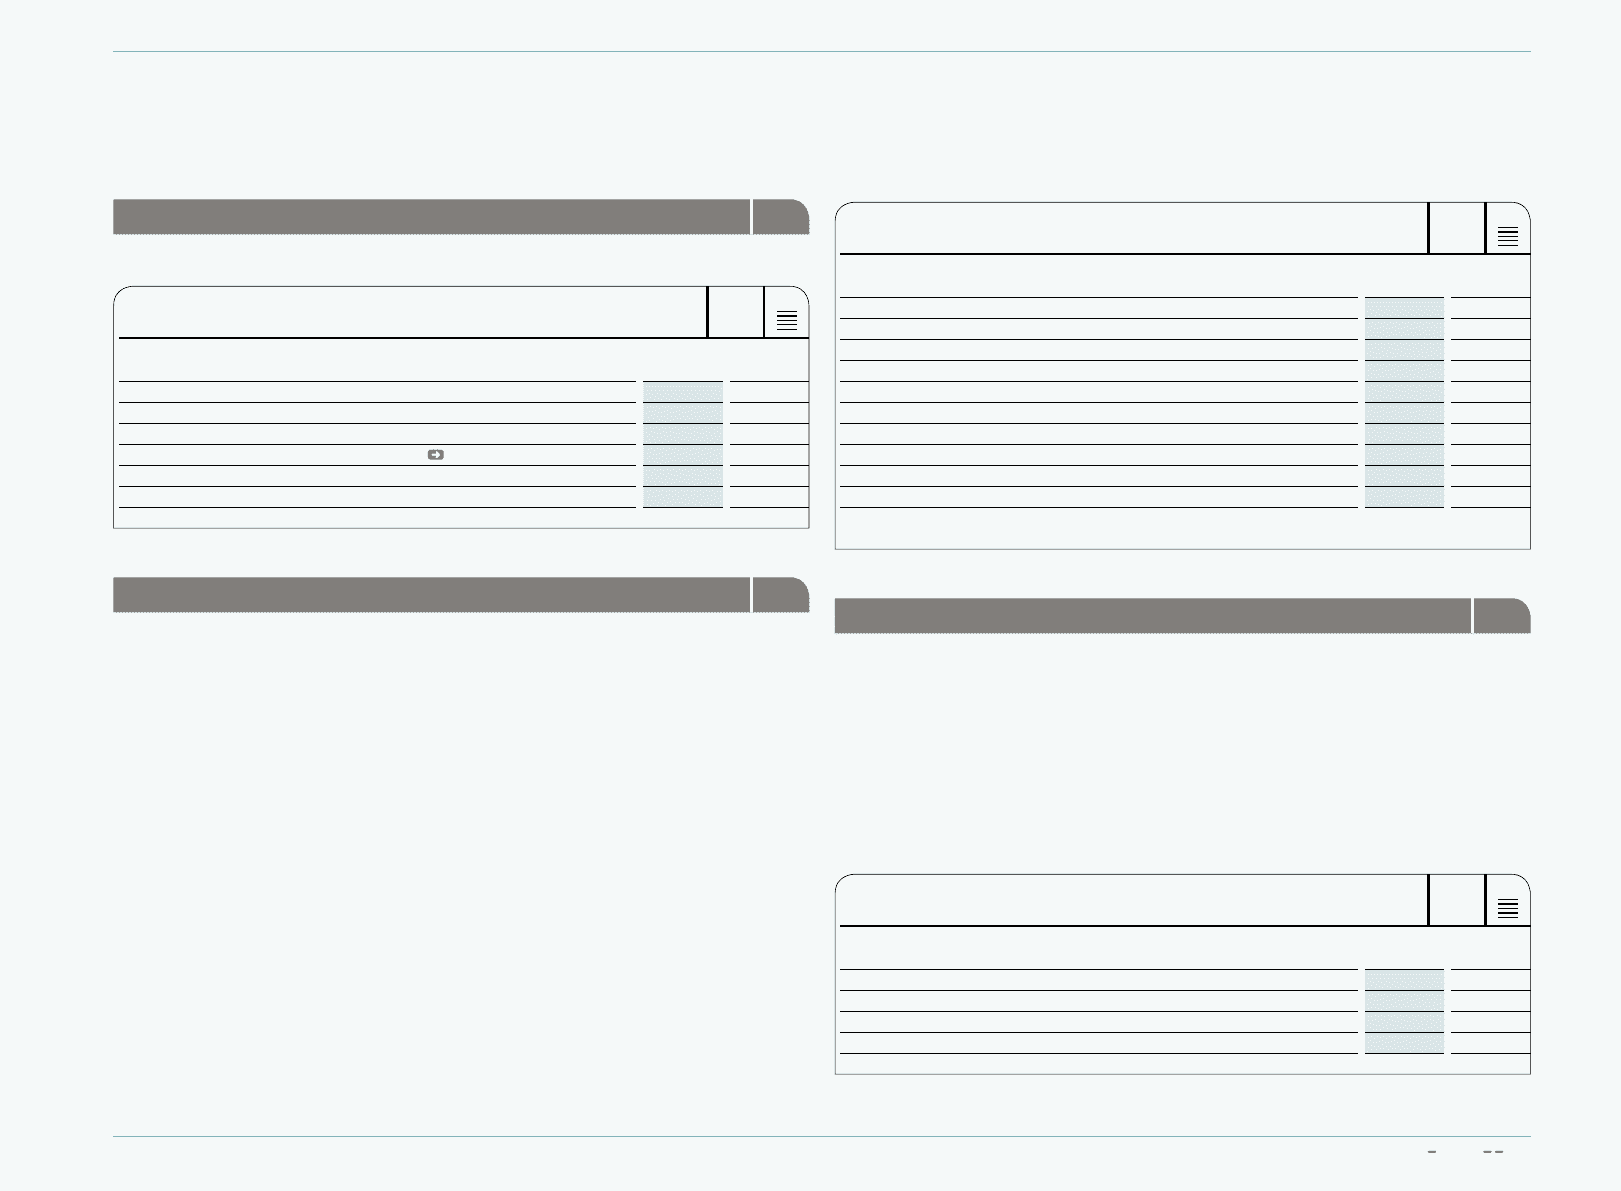
CONSOLIDATED FINANCIAL STATEMENTS Notes 201
Notes to the Consolidated Income StatementNotes to the Consolidated Income Statement
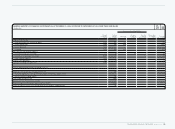
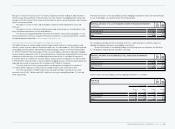
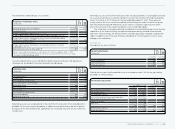
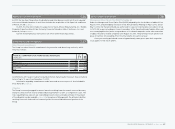
Other operating income 29
Other operating income consists of the following:
N
°-
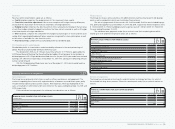
29
OTHER OPERATING INCOME
€ IN MILLIONS
Year ending
Dec. 31, 2009 Year ending
Dec. 31, 2008
Income from accounts receivable previously written off 2 2
Income from release of accruals and provisions 31 28
Gains from disposal of fixed assets 3 10
Income from the recognition of negative goodwill ( see Note 4) — 21
Other revenues 64 42
Total 100 103
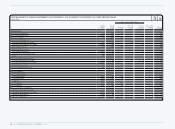
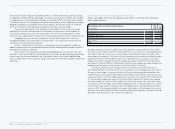
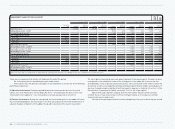
Other operating expenses 30
Operating expenses include expenses for sales, marketing, research and development, as well
as for logistics and central finance and administration. In addition, they include depreciation on
tangible assets and amortisation on intangible assets, with the exception of depreciation and
amortisation which is included in the cost of sales.
Marketing working budget is the largest component of other operating expenses. The
marketing working budget consists of promotion and communication spending such as promotion
contracts, advertising, events and other communication activities. However, it does not include
marketing overhead expenses. In 2009, marketing working budget accounted for approximately
23% (2008: 26%) of the total other operating expenses.
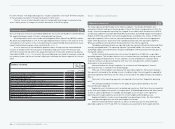
Total depreciation and amortisation expense for tangible and intangible assets (excluding
goodwill) was € 299 million and € 234 million for the years ending December 31, 2009 and 2008,
respectively. Thereof, € 5 million and € 6 million were recorded within the cost of sales as they
are directly attributable to the production costs of goods sold.
N
°-
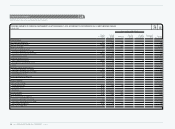
30
OTHER OPERATING EXPENSES
€ IN MILLIONS
Year ending
Dec. 31, 2009 Year ending
Dec. 31, 2008
Marketing working budget 1,028 1,132
Sales working budget 241 297
Marketing overhead 1 ) 348 376
Sales force 1 ) 1,296 1,179
Logistics 1 ) 582 565
Research and development 1 ) 86 81
Central expenses for finance and administration divisions 1 ) 809 748
Total 4,390 4,378
Thereof:
Depreciation and amortisation 294 228
1) Including personnel and administration expenses.
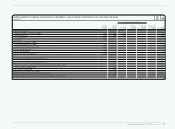
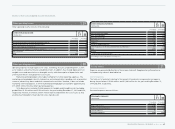
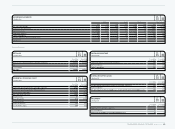
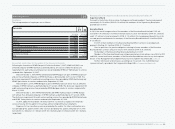
Cost by nature 31
Expenses are presented by function in the income statement. Supplementary information on
the expenses by nature is detailed below.
Cost of materials Cost of materials
The total cost of materials relating to the amount of inventories recognised as an expense
during the period was € 5,546 million and € 5,486 million for the years ending December 31,
2009 and 2008, respectively.
Personnel expensesPersonnel expenses
Personnel expenses were as follows:
N
°-
31
PERSONNEL EXPENSES
€ IN MILLIONS
Year ending
Dec. 31, 2009 Year ending
Dec. 31, 2008
Wages and salaries 1,185 1,123
Social security contributions 114 110
Pension expenses 53 50
Personnel expenses 1,352 1,283