Reebok 2009 Annual Report Download - page 134
Download and view the complete annual report
Please find page 134 of the 2009 Reebok annual report below. You can navigate through the pages in the report by either clicking on the pages listed below, or by using the keyword search tool below to find specific information within the annual report.-
 1
1 -
2
-
3
-
4
-
5
-
6
-
7
-
8
-
9
-
10
-
11
-
12
-
13
-
14
-
15
-
16
-
17
-
18
-
19
-
20
-
21
-
22
-
23
-
24
-
25
-
26
-
27
-
28
-
29
-
30
-
31
-
32
-
33
-
34
-
35
-
36
-
37
-
38
-
39
-
40
-
41
-
42
-
43
-
44
-
45
-
46
-
47
-
48
-
49
-
50
-
51
-
52
-
53
-
54
-
55
-
56
-
57
-
58
-
59
-
60
-
61
-
62
-
63
-
64
-
65
-
66
-
67
-
68
-
69
-
70
-
71
-
72
-
73
-
74
-
75
-
76
-
77
-
78
-
79
-
80
-
81
-
82
-
83
-
84
-
85
-
86
-
87
-
88
-
89
-
90
-
91
-
92
-
93
-
94
-
95
-
96
-
97
-
98
-
99
-
100
-
101
-
102
-
103
-
104
-
105
-
106
-
107
-
108
-
109
-
110
-
111
-
112
-
113
-
114
-
115
-
116
-
117
-
118
-
119
-
120
-
121
-
122
-
123
-
 124
124 -
 125
125 -
 126
126 -
 127
127 -
 128
128 -
 129
129 -
 130
130 -
 131
131 -
 132
132 -
 133
133 -
 134
134 -
 135
135 -
 136
136 -
 137
137 -
 138
138 -
 139
139 -
 140
140 -
 141
141 -
 142
142 -
 143
143 -
 144
144 -
145
-
146
-
147
-
148
-
149
-
150
-
151
-
152
-
153
-
154
-
155
-
156
-
157
-
158
-
159
-
160
-
161
-
162
-
163
-
164
-
165
-
166
-
167
-
168
-
169
-
170
-
171
-
172
-
173
-
174
-
175
-
176
-
177
-
178
-
179
-
180
-
181
-
182
-
183
-
184
-
185
-
186
-
187
-
188
-
189
-
190
-
191
-
192
-
193
-
194
-
195
-
196
-
197
-
198
-
199
-
200
-
201
-
202
-
203
-
204
-
205
-
206
-
207
-
208
-
209
-
210
-
211
-
212
-
213
-
214
-
215
-
216
-
217
-
218
-
219
-
220
-
221
-
222
-
223
-
224
-
225
-
226
-
227
-
228
-
229
-
230
-
231
-
232
-
233
-
234
 |
 |

130 GROUP MANAGEMENT REPORT – FINANCIAL REVIEW GROUP BUSINESS PERFORMANCE Treasury
N
°-
51
N
°-
49
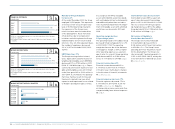
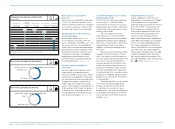
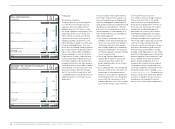
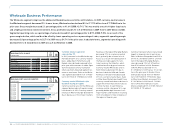
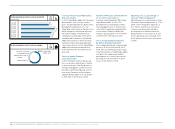
INTEREST RATE DEVELOPMENT 1 )
IN %
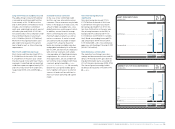
NET CASH (NET BORROWINGS)
€ IN MILLIONS
2005
2006
2007
2008
2009
2005
2006 1 )
2007
2008
2009
4.0
4.8
5.3
5.2
5.2
551
(2,231)
(1,766)
(2,189)
(917)
1) Weighted average interest rate of gross borrowings.
1) At end of period.
1) Including Reebok, Rockport and Reebok-CCM Hockey from February 1, 2006
onwards.
N
°-
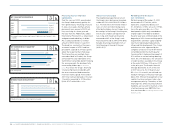
50
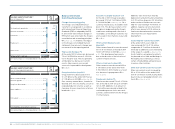
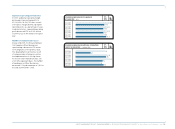
NET BORROWINGS BY QUARTER 1 )
€ IN MILLIONS
Q1 2008
Q1 2009
Q2 2008
Q2 2009
Q3 2008
Q3 2009
Q4 2008
Q4 2009
2,073 2,883
2,260 2,732
2,593
2,294
2,189
917
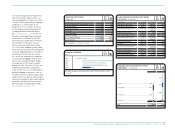
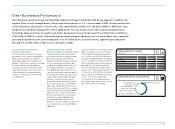
Financing structure improved
significantly
Over the course of 2009, we extended
the Group’s debt maturity profile, fur-
ther optimising our financing structure.
In June, we issued a German private
placement in an amount of € 200 mil-
lion, consisting of a three-year and
five-year tranche. Additionally, adidas
International Finance B.V., a fully owned
and guaranteed subsidiary of adidas
AG, issued a Eurobond in a nominal
amount of € 500 million in July 2009.
The bond has a maturity of five years,
an annual coupon of 4.75% and was
priced with a spread of 200 basis points
above the respective Euro mid-swap.
The transaction was multiple times
oversubscribed. In October, the Group
announced the early redemption of its
€ 400 million convertible bond. Following
the announcement, the bond was fully
converted by holders see Our Share,
p. 42. As a result, the Group’s financing
structure improved considerably with
the term structure of debt maturities
now more evenly spread. At the end of
2009, total refinancing needs in the next
12 months amounted to € 198 million
(2008: € 797 million) see 55.
Interest rate unchanged
The weighted average interest rate on
the Group’s gross borrowings remained
stable at 5.2% in 2009 (2008: 5.2%) see
51. Positive effects from lower interest
rates on short-term borrowings were
offset by the higher share of longer-term
borrowings in the Group’s financing mix,
which carry a higher average interest
rate. Long-term fixed-rate financing
amounted to 68% of the Group’s total
financing at the end of 2009 (2008: 58%).
Variable financing amounted to 32% of
total financing at the end of the year
(2008: 42%).
Net debt position decreases
by € 1.272 billion
Net borrowings at December 31, 2009
amounted to € 917 million, which
represents a substantial decrease of
€ 1.272 billion, or 58%, versus € 2.189 bil-
lion in the prior year see 49. This
development significantly exceeded our
original target of net debt to be below
the prior year level communicated at the
beginning of 2009. Lower working capital
requirements and lower capital expendi-
ture than originally planned positively
influenced this development. The strong
reduction was also supported by the
complete conversion of our € 400 million
convertible bond in the fourth quarter.
Currency effects had a positive impact of
€ 12 million on net borrowings develop-
ment. On a net debt basis, the utilisation
of credit facilities available to the Group
at the end of 2009 was 16% versus 33%
in the prior year. The Group’s financial
leverage declined to 24.3% at the end
of 2009 versus 64.6% in the prior year
see 53. As a result, we achieved our
medium-term goal of financial leverage
below 50%. Efficient management of our
capital structure continues to be a top
management priority. Therefore, to limit
financing risks while ensuring sufficient
flexibility, we now aim to maintain a ratio
of net borrowings over EBITDA of less
than two times see Subsequent Events and
Outlook, p. 156.