Reebok 2009 Annual Report Download - page 141
Download and view the complete annual report
Please find page 141 of the 2009 Reebok annual report below. You can navigate through the pages in the report by either clicking on the pages listed below, or by using the keyword search tool below to find specific information within the annual report.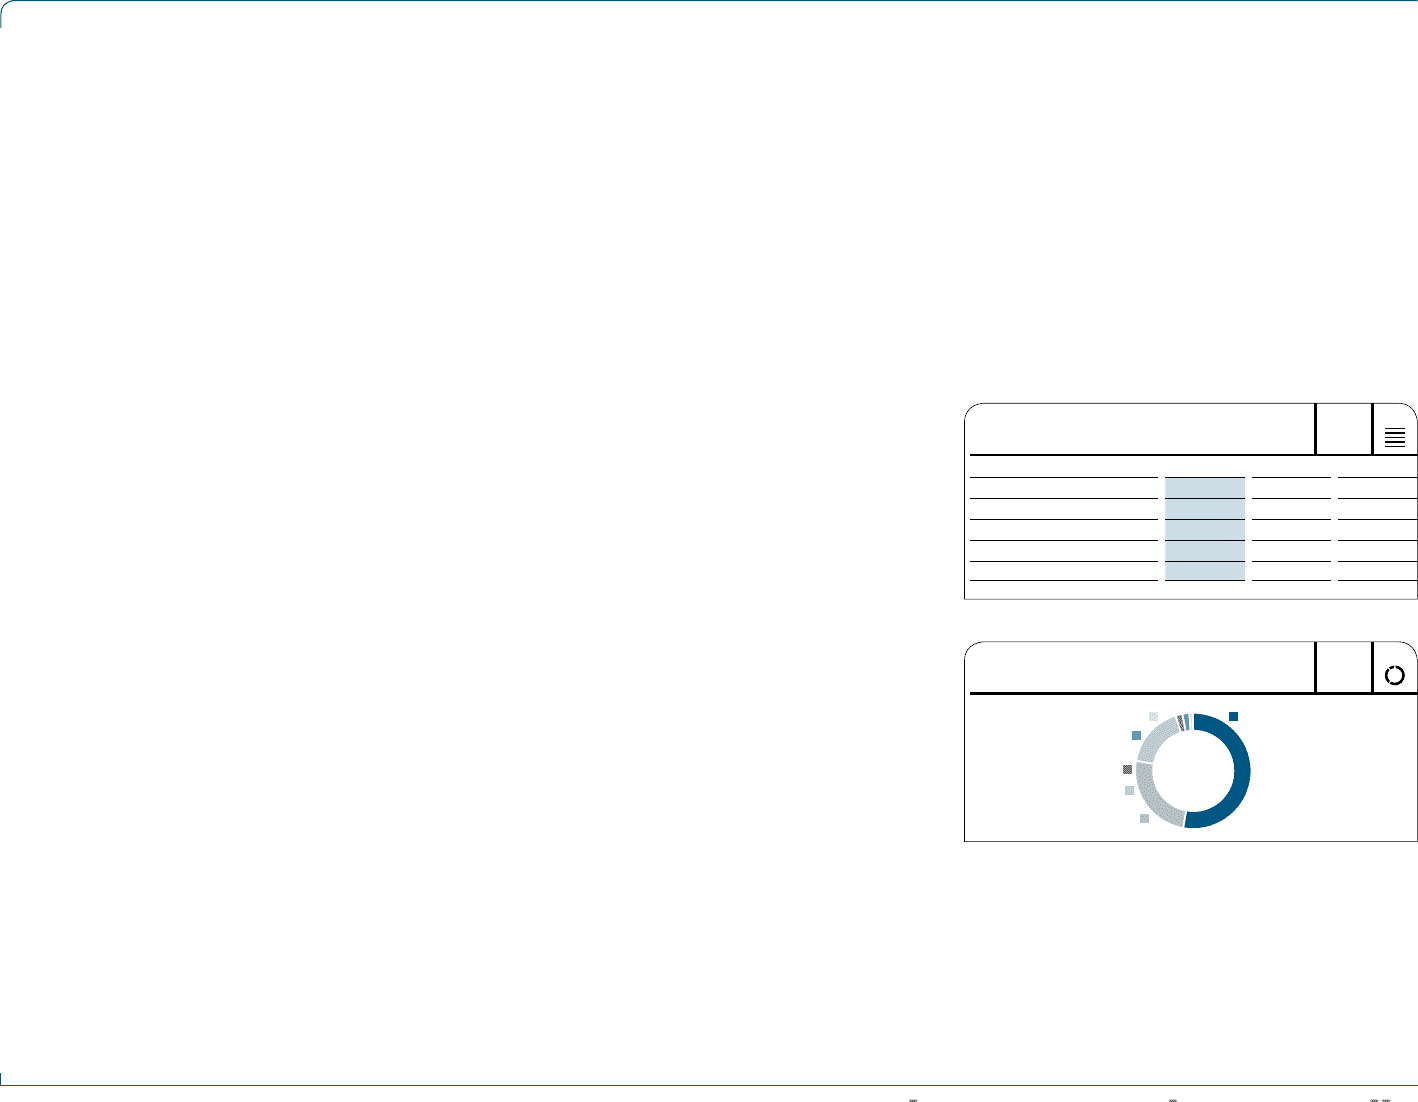
GROUP MANAGEMENT REPORT – FINANCIAL REVIEW BUSINESS PERFORMANCE BY SEGMENT Other Businesses Performance 137
Other Businesses Performance
Other Businesses primarily include the TaylorMade-adidas Golf, Rockport and Reebok-CCM Hockey segments. In addition, the
segment Other centrally managed brands, which comprises brands such as Y-3, is also included. In 2009, currency-neutral sales
of Other Businesses decreased 4%. In euro terms, sales remained almost stable at € 1.283 billion (2008: € 1.285 billion). Gross
margin decreased 2.8 percentage points to 39.4% (2008: 42.2%). This was mainly a result of price repositioning initiatives at
TaylorMade-adidas Golf due to the negative golf market development. Gross profit decreased 7% to € 506 million in 2009 from
€ 543 million in 2008. As a result of the decline in gross margin and higher operating costs as a percentage of sales, segmental
operating margin decreased 4.3 percentage points to 21.9% (2008: 26.2%). In absolute terms, segmental operating profit
declined 17% to € 281 million in 2009 versus € 337 million in 2008.
N
°-
01
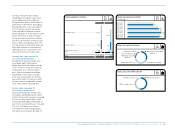
OTHER BUSINESSES AT A GLANCE
€ IN MILLIONS
2009 2008 Change
Net sales 1,283 1,285 (0%)
Gross profit 506 543 (7%)
Gross margin 39.4% 42.2% (2.8pp)
Segmental operating profit 281 337 (17%)
Segmental operating margin 21.9% 26.2% (4.3pp)
Currency-neutral sales of Other
Businesses decline 4%
In 2009, revenues for Other Businesses
declined 4% on a currency-neutral basis.
While sales declined in the segments
TaylorMade-adidas Golf, Rockport and
Reebok-CCM Hockey, revenues increased
at Other centrally managed brands.
Currency translation effects positively
impacted revenues in euro terms. Sales
of Other Businesses remained almost
stable at € 1.283 billion in 2009 (2008:
€ 1.285 billion).
Currency-neutral sales of Other
Businesses decline in nearly all regions
Currency-neutral sales of Other Busi-
nesses decreased in all regions except
Western Europe and Latin America.
Revenues in Western Europe increased
10% on a currency-neutral basis due
to higher TaylorMade-adidas Golf sales
in the region. Revenues in European
Emerging Markets decreased 2% on a
currency-neutral basis primarily due to
lower Reebok-CCM Hockey sales which
could not be offset by higher Rockport
revenues. Currency-neutral sales in
North America decreased 5% primarily
due to sales decreases at TaylorMade-
adidas Golf and Rockport. Revenues in
Greater China declined 9% on a currency-
neutral basis due to lower TaylorMade-
adidas Golf sales. Sales in Other Asian
Markets decreased 8% on a currency-
neutral basis, impacted by declines
at TaylorMade-adidas Golf. In Latin
America, currency-neutral sales grew 3%
as a result of increases at TaylorMade-
adidas Golf.
Currency translation effects had a mixed
impact on regional sales in euro terms.
Sales in Western Europe increased 3%
to € 214 million (2008: € 208 million). In
European Emerging Markets, sales grew
3% to € 30 million in 2009 from € 29 mil-
lion in 2008. Revenues in North America
declined 2% to € 685 million in 2009
versus € 695 million in the prior year. In
Greater China, revenues decreased 3% to
€ 24 million in 2009 (2008: € 25 million).
Sales in Other Asian Markets increased
1% to € 319 million in 2009 from
€ 316 million in 2008, and revenues in
Latin America decreased 1% to € 12 mil-
lion in 2009 (2008: € 12 million).
N
°-
02
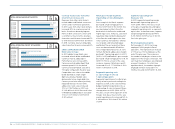
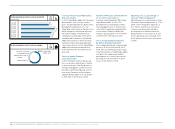
OTHER BUSINESSES NET SALES BY REGION
2% Greater China
25% Other Asian Markets
17% Western Europe
2% European
Emerging Markets
53% North America1% Latin America


