Reebok 2009 Annual Report Download - page 115
Download and view the complete annual report
Please find page 115 of the 2009 Reebok annual report below. You can navigate through the pages in the report by either clicking on the pages listed below, or by using the keyword search tool below to find specific information within the annual report.-
 1
1 -
2
-
3
-
4
-
5
-
6
-
7
-
8
-
9
-
10
-
11
-
12
-
13
-
14
-
15
-
16
-
17
-
18
-
19
-
20
-
21
-
22
-
23
-
24
-
25
-
26
-
27
-
28
-
29
-
30
-
31
-
32
-
33
-
34
-
35
-
36
-
37
-
38
-
39
-
40
-
41
-
42
-
43
-
44
-
45
-
46
-
47
-
48
-
49
-
50
-
51
-
52
-
53
-
54
-
55
-
56
-
57
-
58
-
59
-
60
-
61
-
62
-
63
-
64
-
65
-
66
-
67
-
68
-
69
-
70
-
71
-
72
-
73
-
74
-
75
-
76
-
77
-
78
-
79
-
80
-
81
-
82
-
83
-
84
-
85
-
86
-
87
-
88
-
89
-
90
-
91
-
92
-
93
-
94
-
95
-
96
-
97
-
98
-
99
-
100
-
101
-
102
-
103
-
104
-
 105
105 -
 106
106 -
 107
107 -
 108
108 -
 109
109 -
 110
110 -
 111
111 -
 112
112 -
 113
113 -
 114
114 -
 115
115 -
 116
116 -
 117
117 -
 118
118 -
 119
119 -
 120
120 -
 121
121 -
 122
122 -
 123
123 -
 124
124 -
 125
125 -
126
-
127
-
128
-
129
-
130
-
131
-
132
-
133
-
134
-
135
-
136
-
137
-
138
-
139
-
140
-
141
-
142
-
143
-
144
-
145
-
146
-
147
-
148
-
149
-
150
-
151
-
152
-
153
-
154
-
155
-
156
-
157
-
158
-
159
-
160
-
161
-
162
-
163
-
164
-
165
-
166
-
167
-
168
-
169
-
170
-
171
-
172
-
173
-
174
-
175
-
176
-
177
-
178
-
179
-
180
-
181
-
182
-
183
-
184
-
185
-
186
-
187
-
188
-
189
-
190
-
191
-
192
-
193
-
194
-
195
-
196
-
197
-
198
-
199
-
200
-
201
-
202
-
203
-
204
-
205
-
206
-
207
-
208
-
209
-
210
-
211
-
212
-
213
-
214
-
215
-
216
-
217
-
218
-
219
-
220
-
221
-
222
-
223
-
224
-
225
-
226
-
227
-
228
-
229
-
230
-
231
-
232
-
233
-
234
 |
 |

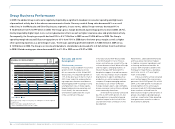
GROUP MANAGEMENT REPORT – FINANCIAL REVIEW Internal Group Management System 111
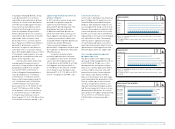
Structured performance
measurement system
Our Group has developed an extensive
performance measurement system,
which utilises a variety of tools to meas-
ure the performance of the adidas Group.
The Group’s key financial metrics are
monitored and compared against budget
on a monthly basis. Focus is on operat-
ing cash flow, sales, operating margin,
operating working capital and net debt
development. When negative deviations
exist between actual and target num-
bers, we perform a detailed analysis to
identify and address the cause. We also
benchmark our Group’s financial results
with those of our major competitors on a
quarterly basis. To assess current sales
and profitability development, Manage-
ment analyses sell-through information
from our own retail distribution as well
as short-term replenishment orders
from retailers. Taking into account year-
to-date performance as well as oppor-
tunities and risks, the Group’s full year
financial performance is forecasted on a
quarterly basis.
In this respect, backlogs comprising
orders received up to nine months in
advance of the actual sale are used as
an indicator. However, due to the grow-
ing share of own retail in our business
mix as well as fluctuating order patterns
among our wholesale partners, our order
books are less indicative of anticipated
revenues compared to the past. As a
result of the growing share of at-once
business, qualitative feedback from our
retail partners on the success of our col-
lections at the point of sale is becoming
even more important. As an early indica-
tor for future performance, we also con-
duct market research to measure brand
appeal, brand awareness and resulting
purchase intent.
Management appraisal of
performance and targets
We communicate our Group’s financial
targets on an annual basis. We also
provide updates throughout the year as
appropriate. In 2009, Group sales and
net income declined as forecasted at the
beginning of the year. While Group and
adidas sales declined at a mid-single-
digit rate as projected, sales at Reebok
and TaylorMade-adidas Golf did not meet
our expectations.
Group sales development under -
performed macroeconomic and global
industry growth see Economic and Sector
Development, p. 112, as we experienced
challenges in markets such as North
America and Greater China. Profitability
declined as anticipated as a result of
lower gross margins and higher operat-
ing expenses as a percentage of sales.
Due to our strong focus on operating
working capital and cash management,
we achieved all of our goals related
to balance sheet
improvements. Our
expectations for the Group’s business
performance in
2010 are based on the
assumption of an improvement in the
global economy. However, we expect that
consumer spending increases will lag
behind overall economic growth rates.
This, as well as an improved balance
sheet and positive effects from actions
to reduce costs taken in 2009, should
lead to increases in both sales and
profitability in 2010. In 2011, assuming
further improvements in the global
economy, we are confident to increase
sales and earnings per share compared
to 2010. We believe our outlook is
realistic within the scope of the current
trading environment. No material event
between the end of 2009 and the publi-
cation of this report has altered our view
see Subsequent Events and Outlook, p. 156.