Reebok 2009 Annual Report Download - page 94
Download and view the complete annual report
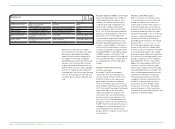
Please find page 94 of the 2009 Reebok annual report below. You can navigate through the pages in the report by either clicking on the pages listed below, or by using the keyword search tool below to find specific information within the annual report.-
 1
1 -
2
-
3
-
4
-
5
-
6
-
7
-
8
-
9
-
10
-
11
-
12
-
13
-
14
-
15
-
16
-
17
-
18
-
19
-
20
-
21
-
22
-
23
-
24
-
25
-
26
-
27
-
28
-
29
-
30
-
31
-
32
-
33
-
34
-
35
-
36
-
37
-
38
-
39
-
40
-
41
-
42
-
43
-
44
-
45
-
46
-
47
-
48
-
49
-
50
-
51
-
52
-
53
-
54
-
55
-
56
-
57
-
58
-
59
-
60
-
61
-
62
-
63
-
64
-
65
-
66
-
67
-
68
-
69
-
70
-
71
-
72
-
73
-
74
-
75
-
76
-
77
-
78
-
79
-
80
-
81
-
82
-
83
-
 84
84 -
 85
85 -
 86
86 -
 87
87 -
 88
88 -
 89
89 -
 90
90 -
 91
91 -
 92
92 -
 93
93 -
 94
94 -
 95
95 -
 96
96 -
 97
97 -
 98
98 -
 99
99 -
 100
100 -
 101
101 -
 102
102 -
 103
103 -
 104
104 -
105
-
106
-
107
-
108
-
109
-
110
-
111
-
112
-
113
-
114
-
115
-
116
-
117
-
118
-
119
-
120
-
121
-
122
-
123
-
124
-
125
-
126
-
127
-
128
-
129
-
130
-
131
-
132
-
133
-
134
-
135
-
136
-
137
-
138
-
139
-
140
-
141
-
142
-
143
-
144
-
145
-
146
-
147
-
148
-
149
-
150
-
151
-
152
-
153
-
154
-
155
-
156
-
157
-
158
-
159
-
160
-
161
-
162
-
163
-
164
-
165
-
166
-
167
-
168
-
169
-
170
-
171
-
172
-
173
-
174
-
175
-
176
-
177
-
178
-
179
-
180
-
181
-
182
-
183
-
184
-
185
-
186
-
187
-
188
-
189
-
190
-
191
-
192
-
193
-
194
-
195
-
196
-
197
-
198
-
199
-
200
-
201
-
202
-
203
-
204
-
205
-
206
-
207
-
208
-
209
-
210
-
211
-
212
-
213
-
214
-
215
-
216
-
217
-
218
-
219
-
220
-
221
-
222
-
223
-
224
-
225
-
226
-
227
-
228
-
229
-
230
-
231
-
232
-
233
-
234
 |
 |
Majority of production through
independent suppliers
To minimise production costs, we out-
source over 95% of production to inde-
pendent third-party suppliers, primarily
located in Asia. While we provide them
with detailed specifications for produc-
tion and delivery, these suppliers possess
excellent expertise in cost-efficient high-
volume production of footwear, apparel
and accessories. The latest list of our
suppliers can be found on our website
www.adidas-Group.com/en/sustainability/
suppliers_and_workers.
The adidas Group also operates a
limited amount of own production and
assembly sites in Germany (1), Sweden
(1), Finland (1), the USA (4), Canada (5),
China (1) and Japan (1). In order to
ensure the high quality consumers expect
from our products, we enforce strict
control and inspection procedures at our
suppliers and in our own factories. In
addition, we promote adherence to social
and environmental standards throughout
our supply chain see Sustainability, p. 102.
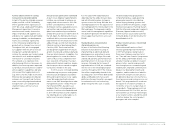
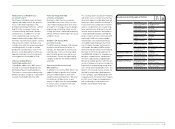
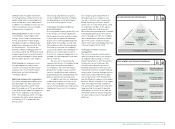
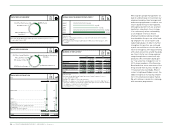
Continued consolidation of
manufacturing partners
In 2009, Global Operations worked with
270 independent manufacturing partners,
representing a 10% reduction compared
to the prior year. This is a result of fur-
ther rationalisation of our supplier base
as well as the overall decline of sourcing
volumes. Of our independent manufac-
turing partners, 74% were located in
Asia, 16% were located in Europe and
10% in the Americas. 32% of all suppliers
were located in China see 02.
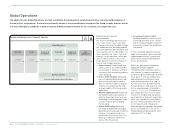
Our Global Operations function
manages product development, com-
mercialisation and distribution, and also
supervises sourcing for our Wholesale
and Retail segments as well as for
adidas Golf see 01. Due to the specific
sourcing requirements in their respec-
tive fields of business, TaylorMade,
Rockport, Reebok-CCM Hockey and the
Sports Licensed Division are not serviced
through Global Operations, but instead
utilise their own purchasing organisa-
tion. In order to quickly seize short-term
opportunities in their local market or
react to trade regulations, Group subsid-
iaries may also source from selected
local suppliers outside the realm of
Global Operations. Local purchases, how-
ever, account only for a minor portion of
the Group’s total sourcing volume.
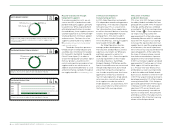
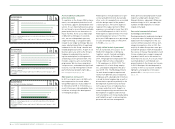
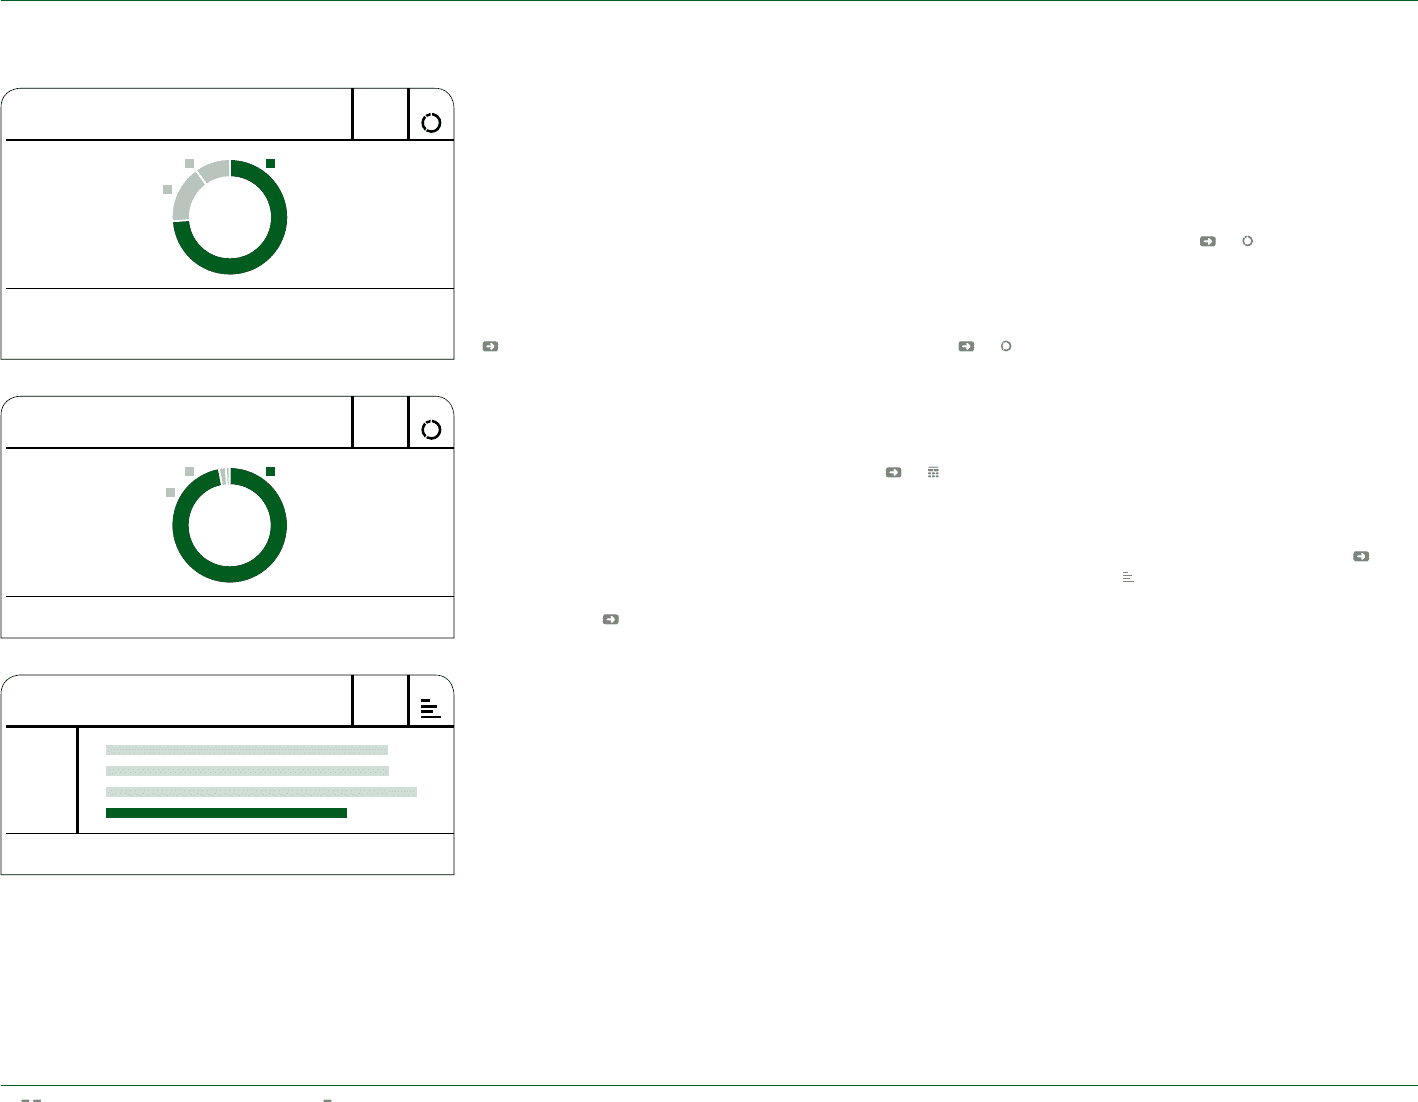
China share of footwear
production decreases
97% of our total 2009 footwear volume
for adidas, Reebok and adidas Golf was
produced in Asia (2008: 97%). Production
in Europe and the Americas combined
accounted for 3% of the sourcing volume
(2008: 3%) see 03. China represents
our largest sourcing country with
approximately 41% of the total volume,
followed by Vietnam with 31% and Indo-
nesia with 17%. As part of our strategy
to increase the regional diversity of our
supplier base to meet the ongoing needs
of our business, the overall representa-
tion of China in our sourcing mix declined
2 percentage points. At the same time,
the share of footwear volume sourced
from India increased almost 2 percent-
age points from a low comparison base.
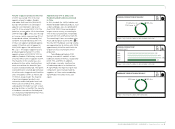
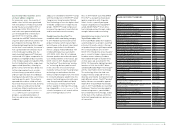
In 2009, our footwear suppliers produced
approximately 171 million pairs of shoes
(2008: approx. 221 million pairs) see
04. The year-over-year decrease was
attributable to a lower sourcing volume
at both the adidas and Reebok brands
due to excess inventories in the first half
of 2009. Our largest footwear factory pro-
duced approximately 11% of the footwear
sourcing volume (2008: 11%). Rockport
purchased approximately 6 million pairs
of footwear in 2009, which represents
a decline of 27% versus the prior year.
Products were primarily sourced from
factories in China (64%), Vietnam (24%)
and Indonesia (10%). The largest factory
accounted for 28% of the total sourcing
volume of the Rockport brand.
90 GROUP MANAGEMENT REPORT – OUR GROUP Global Operations
N
°-
04
FOOTWEAR PRODUCTION 1 )
IN MILLION PAIRS
2006
2007
2008
2009
200
201
221
171
1) Figures only include the adidas, Reebok and adidas Golf brands.
1) Figures only include the adidas, Reebok and adidas Golf brands.
1) Figures include adidas, Reebok and adidas Golf, but exclude local sourcing
partners, sourcing agents, subcontractors, second tier suppliers and
licensee factories.
N
°-
02
N
°-
03
SUPPLIERS BY REGION 1 )
FOOTWEAR PRODUCTION BY REGION 1 )
10% Americas
16% Europe
1% Americas
2% Europe
74% Asia
97% Asia