Reebok 2009 Annual Report Download - page 120
Download and view the complete annual report
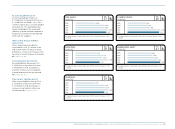
Please find page 120 of the 2009 Reebok annual report below. You can navigate through the pages in the report by either clicking on the pages listed below, or by using the keyword search tool below to find specific information within the annual report.-
 1
1 -
2
-
3
-
4
-
5
-
6
-
7
-
8
-
9
-
10
-
11
-
12
-
13
-
14
-
15
-
16
-
17
-
18
-
19
-
20
-
21
-
22
-
23
-
24
-
25
-
26
-
27
-
28
-
29
-
30
-
31
-
32
-
33
-
34
-
35
-
36
-
37
-
38
-
39
-
40
-
41
-
42
-
43
-
44
-
45
-
46
-
47
-
48
-
49
-
50
-
51
-
52
-
53
-
54
-
55
-
56
-
57
-
58
-
59
-
60
-
61
-
62
-
63
-
64
-
65
-
66
-
67
-
68
-
69
-
70
-
71
-
72
-
73
-
74
-
75
-
76
-
77
-
78
-
79
-
80
-
81
-
82
-
83
-
84
-
85
-
86
-
87
-
88
-
89
-
90
-
91
-
92
-
93
-
94
-
95
-
96
-
97
-
98
-
99
-
100
-
101
-
102
-
103
-
104
-
105
-
106
-
107
-
108
-
109
-
 110
110 -
 111
111 -
 112
112 -
 113
113 -
 114
114 -
 115
115 -
 116
116 -
 117
117 -
 118
118 -
 119
119 -
 120
120 -
 121
121 -
 122
122 -
 123
123 -
 124
124 -
 125
125 -
 126
126 -
 127
127 -
 128
128 -
 129
129 -
 130
130 -
131
-
132
-
133
-
134
-
135
-
136
-
137
-
138
-
139
-
140
-
141
-
142
-
143
-
144
-
145
-
146
-
147
-
148
-
149
-
150
-
151
-
152
-
153
-
154
-
155
-
156
-
157
-
158
-
159
-
160
-
161
-
162
-
163
-
164
-
165
-
166
-
167
-
168
-
169
-
170
-
171
-
172
-
173
-
174
-
175
-
176
-
177
-
178
-
179
-
180
-
181
-
182
-
183
-
184
-
185
-
186
-
187
-
188
-
189
-
190
-
191
-
192
-
193
-
194
-
195
-
196
-
197
-
198
-
199
-
200
-
201
-
202
-
203
-
204
-
205
-
206
-
207
-
208
-
209
-
210
-
211
-
212
-
213
-
214
-
215
-
216
-
217
-
218
-
219
-
220
-
221
-
222
-
223
-
224
-
225
-
226
-
227
-
228
-
229
-
230
-
231
-
232
-
233
-
234
 |
 |
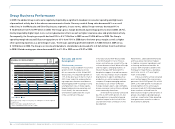
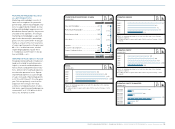
116 GROUP MANAGEMENT REPORT – FINANCIAL REVIEW GROUP BUSINESS PERFORMANCE Income Statement
Group sales decline due to decreases
in Wholesale and Other Businesses
The adidas Group’s sales development
differed significantly by segment in
2009. Currency-neutral Wholesale rev-
enues decreased 9% during the period,
impacted by declines in both adidas and
Reebok sales. Currency-neutral Retail
sales increased 7% versus the prior year
as a result of higher adidas and Reebok
sales. Revenues in Other Businesses
declined 4% on a currency- neutral
basis, primarily impacted by lower
TaylorMade- adidas Golf and Rockport
sales see 11.
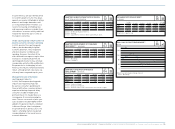
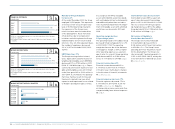
Currency translation effects
positively impacted segmental sales
in euro terms. Wholesale revenues
decreased 8% to € 7.174 billion in 2009
from € 7.758 billion in 2008. Retail sales
increased 10% to € 1.906 billion versus
€ 1.738 billion in the prior year. Sales
in Other Businesses remained almost
stable at € 1.283 billion in 2009 (2008:
€ 1.285 billion) see 12.
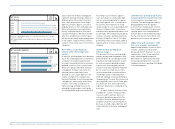
Currency-neutral sales decrease
in nearly all regions
Currency-neutral adidas Group sales
declined in all regions except Latin
America in 2009. Revenues in Western
Europe declined 5% primarily as a result
of lower sales in France and Iberia.
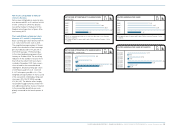
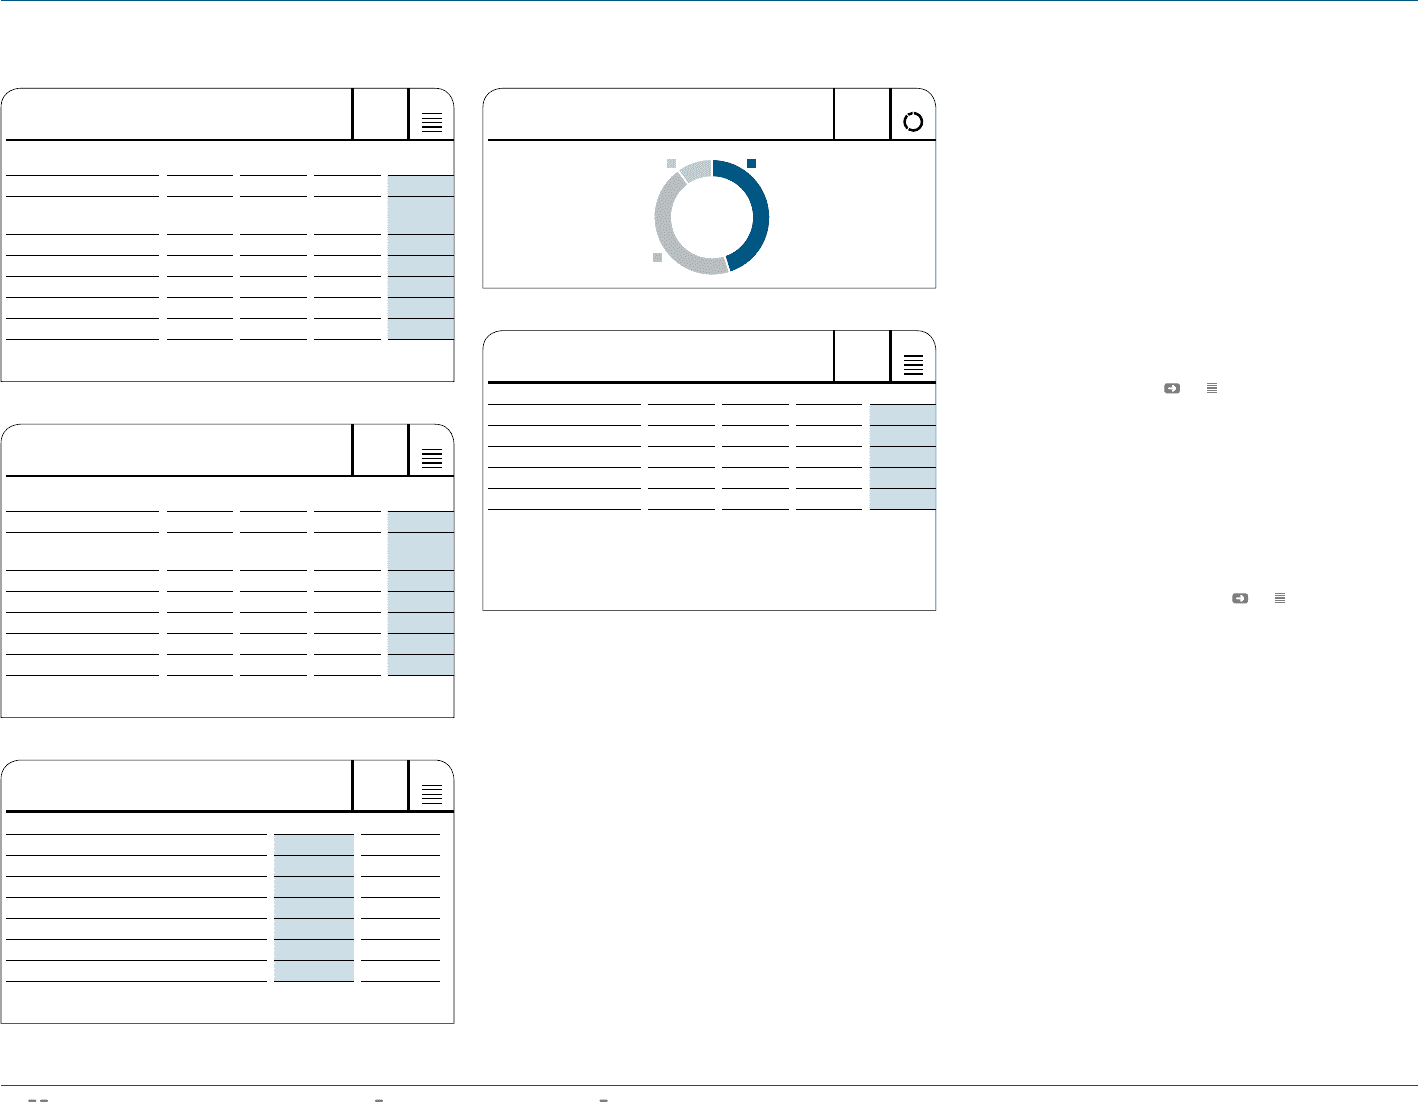
N
°-
1 4
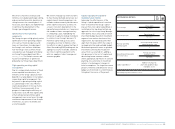
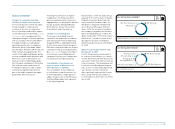
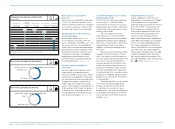
2009 NET SALES BY PRODUCT CATEGORY
10% Hardware
45% Apparel
45% Footwear
N
°-
1 5
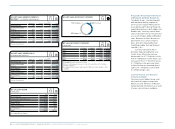
NET SALES BY PRODUCT CATEGORY
€ IN MILLIONS
Footwear Apparel Hardware Total 1 )
2005 2 ) 2,978 2,798 860 6,636
2006 3 ) 4,733 4,105 1,246 10,084
2007 4,751 4,426 1,121 10,299
2008 4,919 4,775 1,105 10,799
2009 4,642 4,663 1,076 10,381
1) Rounding differences may arise in totals.
2) Reflects continuing operations as a result of the divestiture of the Salomon
business segment.
3) Including Reebok, Rockport and Reebok-CCM Hockey from February 1, 2006
onwards.
N
°-
1 3
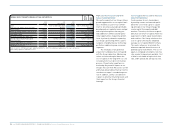
NET SALES BY REGION
€ IN MILLIONS
2009 2008
Western Europe 3,262 3,527
European Emerging Markets 1,122 1,179
North America 2,360 2,520
Greater China 967 1,077
Other Asian Markets 1,647 1,585
Latin America 1,006 893
Total 1 ) 10,381 10,799
1) Including HQ/Consolidation.
N
°-
1 1
N
°-
1 2
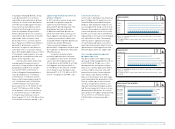
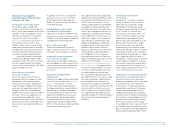
2009 NET SALES GROWTH (CURRENCY-
NEUTRAL) 1 ) BY SEGMENT AND REGION IN %
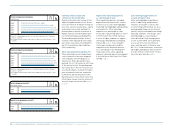
2009 NET SALES GROWTH (IN €) 1 )
BY SEGMENT AND REGION IN %
Wholesale Retail Other
Businesses Total
Western Europe (8) 8 10 (5)
European Emerging
Markets (13) (1) (2) (7)
North America (16) 0 (5) (10)
Greater China (20) 57 (9) (16)
Other Asian Markets (5) 11 (8) (3)
Latin America 16 51 3 19
Total (9) 7 (4) (6)
1) Versus the prior year.
Wholesale Retail Other
Businesses Total
Western Europe (10) 5 3 (8)
European Emerging
Markets (13) 2 3 (5)
North America (11) 5 (2) (6)
Greater China (14) 66 (3) (10)
Other Asian Markets 1 19 1 4
Latin America 10 41 (1) 13
Total (8) 10 0 (4)
1) Versus the prior year.