Reebok 2009 Annual Report Download - page 224
Download and view the complete annual report
Please find page 224 of the 2009 Reebok annual report below. You can navigate through the pages in the report by either clicking on the pages listed below, or by using the keyword search tool below to find specific information within the annual report.-
 1
1 -
2
-
3
-
4
-
5
-
6
-
7
-
8
-
9
-
10
-
11
-
12
-
13
-
14
-
15
-
16
-
17
-
18
-
19
-
20
-
21
-
22
-
23
-
24
-
25
-
26
-
27
-
28
-
29
-
30
-
31
-
32
-
33
-
34
-
35
-
36
-
37
-
38
-
39
-
40
-
41
-
42
-
43
-
44
-
45
-
46
-
47
-
48
-
49
-
50
-
51
-
52
-
53
-
54
-
55
-
56
-
57
-
58
-
59
-
60
-
61
-
62
-
63
-
64
-
65
-
66
-
67
-
68
-
69
-
70
-
71
-
72
-
73
-
74
-
75
-
76
-
77
-
78
-
79
-
80
-
81
-
82
-
83
-
84
-
85
-
86
-
87
-
88
-
89
-
90
-
91
-
92
-
93
-
94
-
95
-
96
-
97
-
98
-
99
-
100
-
101
-
102
-
103
-
104
-
105
-
106
-
107
-
108
-
109
-
110
-
111
-
112
-
113
-
114
-
115
-
116
-
117
-
118
-
119
-
120
-
121
-
122
-
123
-
124
-
125
-
126
-
127
-
128
-
129
-
130
-
131
-
132
-
133
-
134
-
135
-
136
-
137
-
138
-
139
-
140
-
141
-
142
-
143
-
144
-
145
-
146
-
147
-
148
-
149
-
150
-
151
-
152
-
153
-
154
-
155
-
156
-
157
-
158
-
159
-
160
-
161
-
162
-
163
-
164
-
165
-
166
-
167
-
168
-
169
-
170
-
171
-
172
-
173
-
174
-
175
-
176
-
177
-
178
-
179
-
180
-
181
-
182
-
183
-
184
-
185
-
186
-
187
-
188
-
189
-
190
-
191
-
192
-
193
-
194
-
195
-
196
-
197
-
198
-
199
-
200
-
201
-
202
-
203
-
204
-
205
-
206
-
207
-
208
-
209
-
210
-
211
-
212
-
213
-
 214
214 -
 215
215 -
 216
216 -
 217
217 -
 218
218 -
 219
219 -
 220
220 -
 221
221 -
 222
222 -
 223
223 -
 224
224 -
 225
225 -
 226
226 -
 227
227 -
 228
228 -
 229
229 -
 230
230 -
 231
231 -
 232
232 -
 233
233 -
 234
234
 |
 |
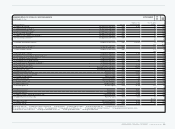
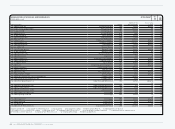
220 ADDITIONAL INFORMATION Ten-Year Overview
N
°-
01
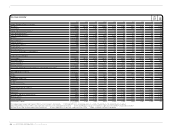
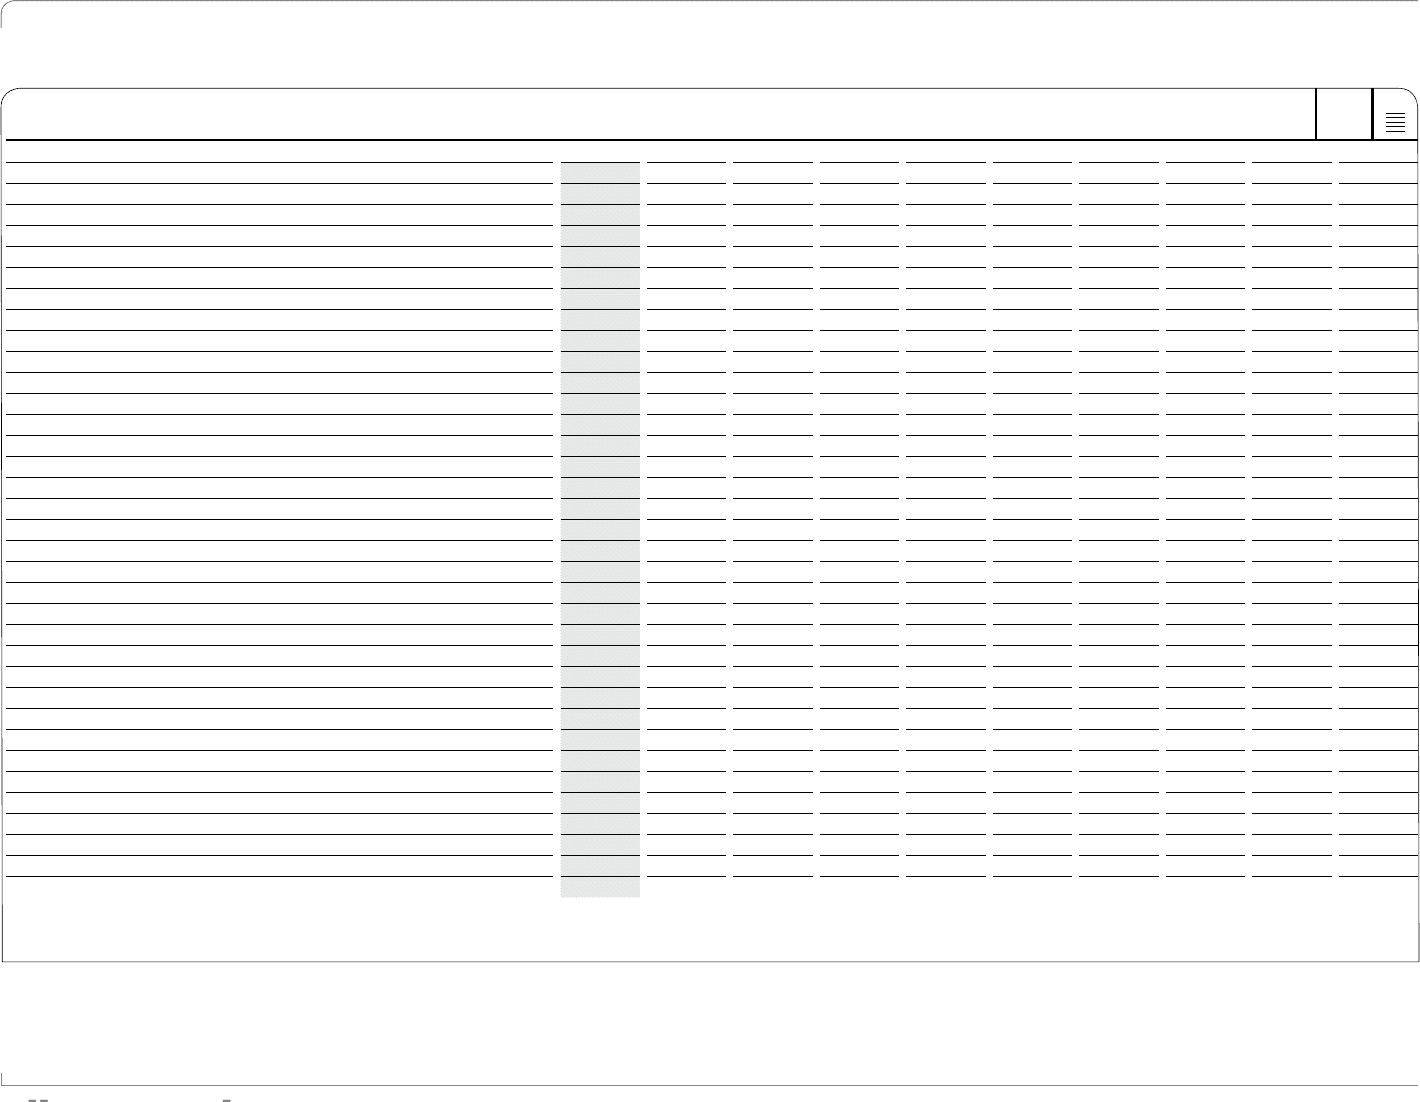
TEN-YEAR OVERVIEW
2009 2008 2007 2006 1 ) 2005 2004 2003 2002 2001 2000
Income Statement Data (€ in millions)
Net sales 2 ) 10,381 10,799 10,299 10,084 6,636 5,860 6,267 6,523 6,112 5,835
Gross profit 2 ) 4,712 5,256 4,882 4,495 3,197 2,813 2,814 2,819 2,601 2,528
Royalty and commission income 2 ) 86 89 102 90 47 42 42 46 42 43
Other operating income 2 ) 100 103 80 55 36 n/a n/a n/a n/a n/a
Other operating expenses 2 ) 4,390 4,378 4,115 3,759 2,573 n/a n/a n/a n/a n/a
EBITDA 2 ) 780 1,280 1,165 1,078 806 716 652 622 620 578
Operating profit 2) 3) 508 1,070 949 881 707 584 490 477 475 437
Financial result 2) 4) (150) (166) (135) (158) (52) (59) (49) (87) (102) (94)
Income before taxes 2) 4) 358 904 815 723 655 526 438 390 376 347
Income taxes 2 ) 113 260 260 227 221 193 167 148 147 140
Minority interests 2) 4) 0 (2) (4) (13) (8) (7) (11) (14) (21) (25)
Net income attributable to shareholders 5 ) 245 642 551 483 383 314 260 229 208 182
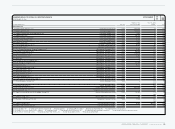
Income Statement Ratios
Gross margin 2 ) 45.4% 48.7% 47.4% 44.6% 48.2% 48.0% 44.9% 43.2% 42.6% 43.3%
Operating margin 2) 3) 4.9% 9.9% 9.2% 8.7% 10.7% 10.0% 7.8% 7.3% 7.8% 7.5%
Interest coverage 2 ) 3.9 7.4 6.8 5.9 18.4 10.2 8.4 6.4 4.9 4.6
Effective tax rate 2 ) 31.5% 28.8% 31.8% 31.4% 33.7% 36.7% 38.0% 37.9% 39.0% 40.3%
Net income attributable to shareholders as a percentage of net sales 5 ) 2.4% 5.9% 5.4% 4.8% 5.8% 5.4% 4.2% 3.5% 3.4% 3.1%
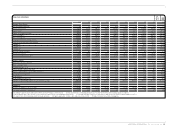
Sales by Brand (€ in millions)
adidas 7,520 7,821 7,113 6,626 5,861 5,174 4,950 5,105 4,825 4,672
Reebok 1,603 1,717 1,831 1,979 — — — — — —
TaylorMade-adidas Golf 831 812 804 856 709 633 637 707 545 441
Rockport 232 243 291 293 — — — — — —
Reebok-CCM Hockey 177 188 210 202 — — — — — —
Balance Sheet Data (€ in millions)
Total assets 4) 8,875 9,533 8,325 8,379 5,750 4,434 4,188 4,261 4,183 4,018
Inventories 1,471 1,995 1,629 1,607 1,230 1,155 1,164 1,190 1,273 1,294
Receivables and other current assets 2,038 2,523 2,048 1,913 1,551 1,425 1,335 1,560 1,520 1,387
Working capital 4) 1,649 1,290 1,522 1,733 2,644 1,336 1,433 1,445 1,485 1,417
Net borrowings 917 2,189 1,766 2,231 (551) 665 1,018 1,498 1,679 1,791
Shareholders’ equity 4) 3,771 3,386 3,023 2,828 2,684 1,544 1,285 1,081 1,015 815
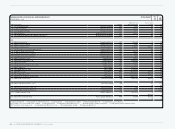
1) Including Reebok, Rockport and Reebok-CCM Hockey from February 1, 2006 onwards. 2) 2004 and 2005 reflect continuing operations as a result of the divestiture of the Salomon business segment.
3) Operating profit figures prior to 2004 exclude royalty and commission income and goodwill amortisation. 4) 2003 and 2004 figures have been restated due to application of IAS 32/IAS 39 and amendment to IAS 19.
5) Includes income from continuing and discontinued operations. 6) Figures adjusted for 1:4 share split conducted on June 6, 2006. 7) Subject to Annual General Meeting approval.