Reebok 2009 Annual Report Download - page 112
Download and view the complete annual report
Please find page 112 of the 2009 Reebok annual report below. You can navigate through the pages in the report by either clicking on the pages listed below, or by using the keyword search tool below to find specific information within the annual report.-
 1
1 -
2
-
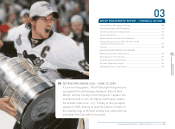
3
-
4
-
5
-
6
-
7
-
8
-
9
-
10
-
11
-
12
-
13
-
14
-
15
-
16
-
17
-
18
-
19
-
20
-
21
-
22
-
23
-
24
-
25
-
26
-
27
-
28
-
29
-
30
-
31
-
32
-
33
-
34
-
35
-
36
-
37
-
38
-
39
-
40
-
41
-
42
-
43
-
44
-
45
-
46
-
47
-
48
-
49
-
50
-
51
-
52
-
53
-
54
-
55
-
56
-
57
-
58
-
59
-
60
-
61
-
62
-
63
-
64
-
65
-
66
-
67
-
68
-
69
-
70
-
71
-
72
-
73
-
74
-
75
-
76
-
77
-
78
-
79
-
80
-
81
-
82
-
83
-
84
-
85
-
86
-
87
-
88
-
89
-
90
-
91
-
92
-
93
-
94
-
95
-
96
-
97
-
98
-
99
-
100
-
101
-
 102
102 -
 103
103 -
 104
104 -
 105
105 -
 106
106 -
 107
107 -
 108
108 -
 109
109 -
 110
110 -
 111
111 -
 112
112 -
 113
113 -
 114
114 -
 115
115 -
 116
116 -
 117
117 -
 118
118 -
 119
119 -
 120
120 -
 121
121 -
 122
122 -
123
-
124
-
125
-
126
-
127
-
128
-
129
-
130
-
131
-
132
-
133
-
134
-
135
-
136
-
137
-
138
-
139
-
140
-
141
-
142
-
143
-
144
-
145
-
146
-
147
-
148
-
149
-
150
-
151
-
152
-
153
-
154
-
155
-
156
-
157
-
158
-
159
-
160
-
161
-
162
-
163
-
164
-
165
-
166
-
167
-
168
-
169
-
170
-
171
-
172
-
173
-
174
-
175
-
176
-
177
-
178
-
179
-
180
-
181
-
182
-
183
-
184
-
185
-
186
-
187
-
188
-
189
-
190
-
191
-
192
-
193
-
194
-
195
-
196
-
197
-
198
-
199
-
200
-
201
-
202
-
203
-
204
-
205
-
206
-
207
-
208
-
209
-
210
-
211
-
212
-
213
-
214
-
215
-
216
-
217
-
218
-
219
-
220
-
221
-
222
-
223
-
224
-
225
-
226
-
227
-
228
-
229
-
230
-
231
-
232
-
233
-
234
 |
 |
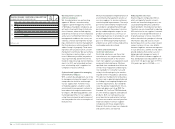
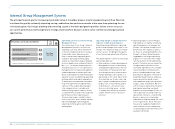
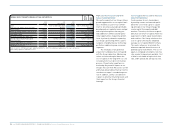
108 GROUP MANAGEMENT REPORT – FINANCIAL REVIEW Internal Group Management System
Internal Group Management System
The principal financial goal for increasing shareholder value at the adidas Group is maximising operating cash flow. We strive
to achieve this goal by continually improving our top- and bottom-line performance while at the same time optimising the use
of invested capital. Our Group’s planning and controlling system is therefore designed to provide a variety of tools to assess
our current performance and to align future strategic and investment decisions to best utilise commercial and organisational
opportunities.
N
°-
01
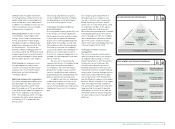
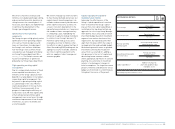
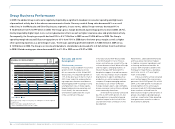
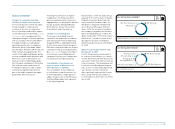
OPERATING CASH FLOW COMPONENTS
1) Capital expenditure less depreciation and amortisation.
Operating profit
Operating
cash flow
Operating working capital
Net re-investments 1 )
Operating cash flow as Internal Group
Management focus
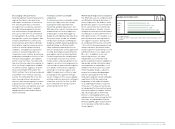
The cornerstone of our Group’s Internal
Management System is our focus on
operating cash flow, which we believe
is the most important driver to increase
shareholder value. Operating cash
flow is comprised of operating profit,
change in operating working capital
and net re-investments (capital expendi-
ture less depreciation and amortisation)
see 01. To maximise operating cash
flow generation across our organisation,
management of our operating segments
and management at market level have
direct responsibility for improving operat-
ing profit as well as optimising operating
working capital and capital expenditure.
To keep senior management focused on
long-term performance improvements,
a portion of the responsible managers’
total compensation is variable and
linked to Group specific targets, as well
as relevant KPIs related to the respective
performance of their operating unit.
These include targets related to items
such as net sales, gross margin, market-
ing working budget, operating profit,
operating working capital and net debt
development.
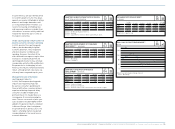
Operating margin as key performance
indicator of operational progress
Operating margin (defined as operating
profit as a percentage of net sales) is our
Group’s most important measure of oper-
ational success. It highlights the quality
of our top line and operational efficiency.
The primary drivers central to enhancing
operating margin are:
Sales and gross margin development:
Management focuses on identifying
and exploiting opportunities that not
only provide for future growth, but
also have potential to increase gross
margin (defined as gross profit as a
percentage of net sales). Major levers
for enhancing our Group’s sales and
gross margin include optimising our
product mix, increasing the quality
of distribution – with a particular
focus on controlled space – as well
as supply chain efficiency initiatives,
and the minimisation of clearance
activities.
Operating expense control: We put
high emphasis on tightly controlling
operating expenses to leverage the
Group’s sales growth through to the
bottom line. This requires a particu-
lar focus on ensuring flexibility in the
Group’s cost base. Marketing work-
ing budget is our largest operating
expense. It is one of the most impor-
tant mechanisms for driving top-line
growth. Therefore, we are committed
to improving the utilisation of our
marketing expenditure. This includes
concentrating our communication
efforts (including advertising, retail
presentation and public relations) on
key global brand initiatives and focus-
ing our promotion spend on well-
selected partnerships with top events,
leagues, clubs and athletes. We also
aim to increase operational efficiency
and reduce operating overhead
expenses as a percentage of sales. In
this respect we constantly review our
operational structure – streamlining
business processes, eliminating
redundancies and leveraging the scale
of our organisation. These measures
may also be supplemented by short-
term initiatives such as temporarily
curtailing operational investments, for
example staff hiring.