Reebok 2009 Annual Report Download - page 124
Download and view the complete annual report
Please find page 124 of the 2009 Reebok annual report below. You can navigate through the pages in the report by either clicking on the pages listed below, or by using the keyword search tool below to find specific information within the annual report.-
 1
1 -
2
-
3
-
4
-
5
-
6
-
7
-
8
-
9
-
10
-
11
-
12
-
13
-
14
-
15
-
16
-
17
-
18
-
19
-
20
-
21
-
22
-
23
-
24
-
25
-
26
-
27
-
28
-
29
-
30
-
31
-
32
-
33
-
34
-
35
-
36
-
37
-
38
-
39
-
40
-
41
-
42
-
43
-
44
-
45
-
46
-
47
-
48
-
49
-
50
-
51
-
52
-
53
-
54
-
55
-
56
-
57
-
58
-
59
-
60
-
61
-
62
-
63
-
64
-
65
-
66
-
67
-
68
-
69
-
70
-
71
-
72
-
73
-
74
-
75
-
76
-
77
-
78
-
79
-
80
-
81
-
82
-
83
-
84
-
85
-
86
-
87
-
88
-
89
-
90
-
91
-
92
-
93
-
94
-
95
-
96
-
97
-
98
-
99
-
100
-
101
-
102
-
103
-
104
-
105
-
106
-
107
-
108
-
109
-
110
-
111
-
112
-
113
-
 114
114 -
 115
115 -
 116
116 -
 117
117 -
 118
118 -
 119
119 -
 120
120 -
 121
121 -
 122
122 -
 123
123 -
 124
124 -
 125
125 -
 126
126 -
 127
127 -
 128
128 -
 129
129 -
 130
130 -
 131
131 -
 132
132 -
 133
133 -
 134
134 -
135
-
136
-
137
-
138
-
139
-
140
-
141
-
142
-
143
-
144
-
145
-
146
-
147
-
148
-
149
-
150
-
151
-
152
-
153
-
154
-
155
-
156
-
157
-
158
-
159
-
160
-
161
-
162
-
163
-
164
-
165
-
166
-
167
-
168
-
169
-
170
-
171
-
172
-
173
-
174
-
175
-
176
-
177
-
178
-
179
-
180
-
181
-
182
-
183
-
184
-
185
-
186
-
187
-
188
-
189
-
190
-
191
-
192
-
193
-
194
-
195
-
196
-
197
-
198
-
199
-
200
-
201
-
202
-
203
-
204
-
205
-
206
-
207
-
208
-
209
-
210
-
211
-
212
-
213
-
214
-
215
-
216
-
217
-
218
-
219
-
220
-
221
-
222
-
223
-
224
-
225
-
226
-
227
-
228
-
229
-
230
-
231
-
232
-
233
-
234
 |
 |
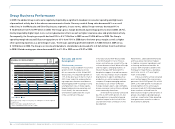
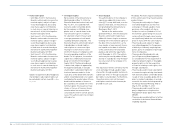
120 GROUP MANAGEMENT REPORT – FINANCIAL REVIEW GROUP BUSINESS PERFORMANCE Income Statement
N
°-
28
N
°-
29
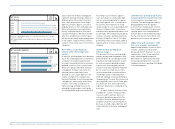
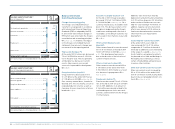
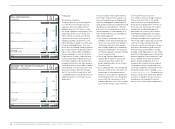
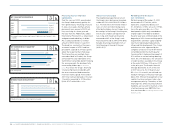
FINANCIAL EXPENSES
€ IN MILLIONS
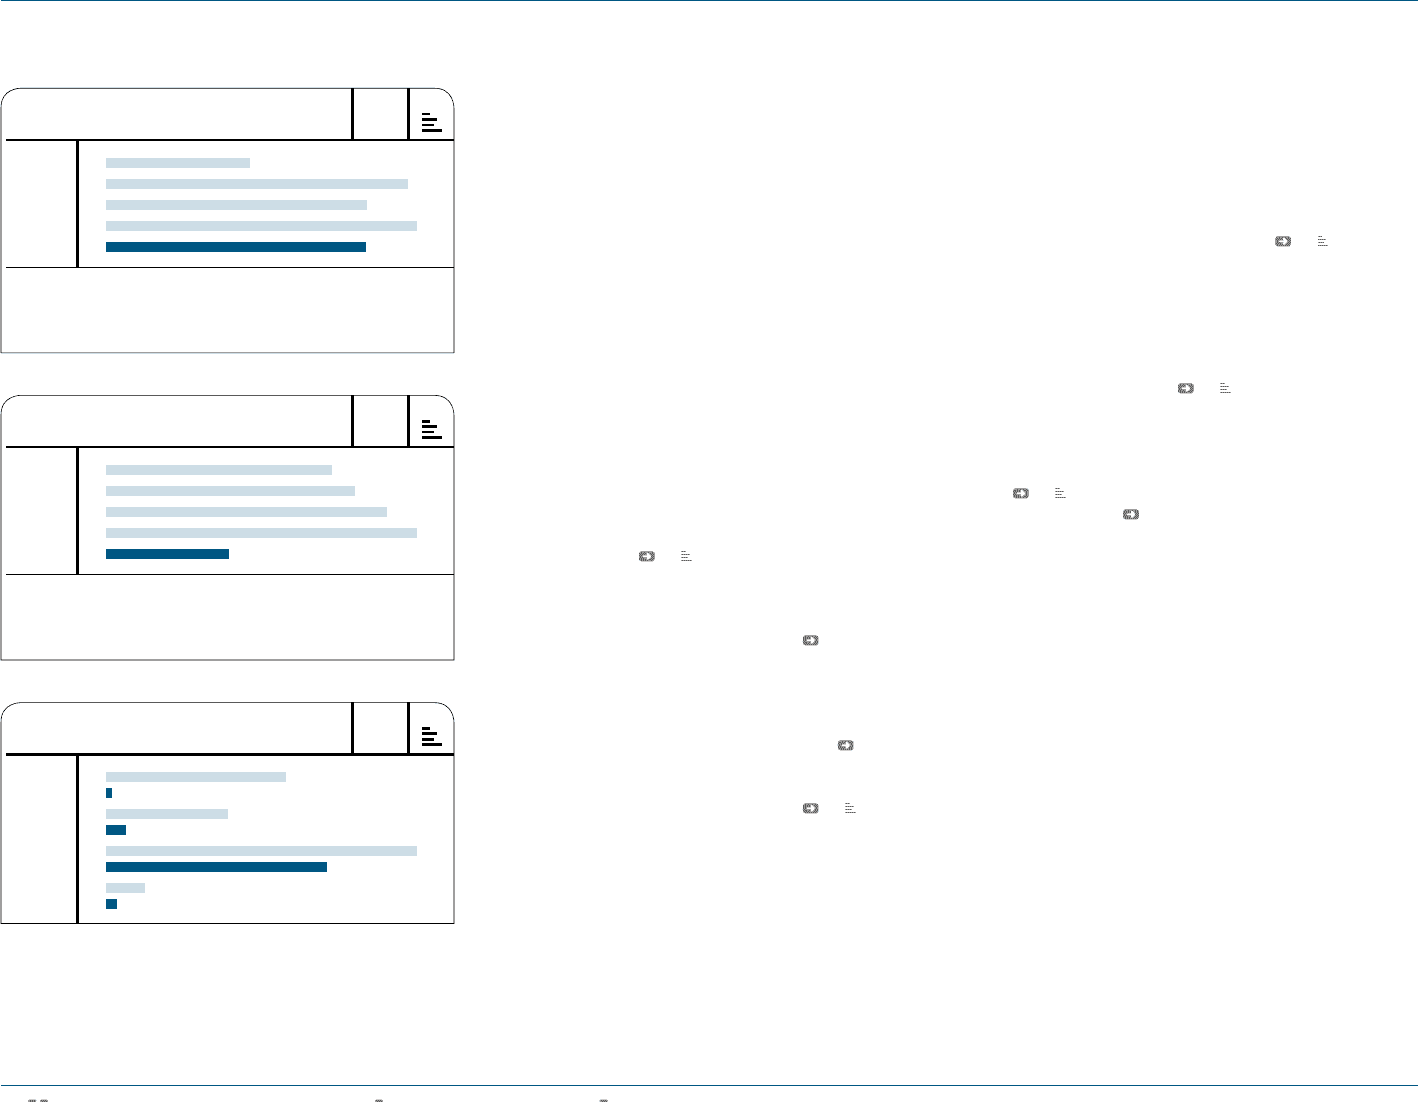
INCOME BEFORE TAXES
€ IN MILLIONS
2005 1 )
2006 2 )
2007
2008
2009
2005 1 )
2006 2 )
2007
2008
2009
94
197
170
203
169
655
723
815
904
358
1) Reflects continuing operations as a result of the divestiture of the Salomon
business segment.
2) Including Reebok, Rockport and Reebok-CCM Hockey from February 1, 2006
onwards.
1) Reflects continuing operations as a result of the divestiture of the Salomon
business segment.
2) Including Reebok, Rockport and Reebok-CCM Hockey from February 1, 2006
onwards.
N
°-
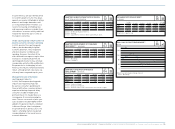
30
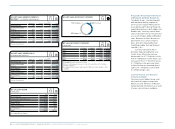
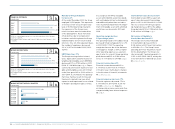
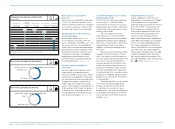
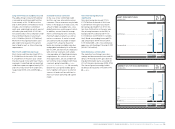
INCOME BEFORE TAXES BY QUARTER
€ IN MILLIONS
Q1 2008
Q1 2009
Q2 2008
Q2 2009
Q3 2008
Q3 2009
Q4 2008
Q4 2009
250
9
169
28
431
306
54
16
Number of Group employees
increases 2%
At the end of December 2009, the Group
employed 39,596 people. This represents
an increase of 2% versus the prior year
level of 38,982. New hirings related to
the expansion of the Group’s own-
retail store base were the main driver
of this develop ment. These more than
offset declines due to reorganisation
initiatives and a hiring freeze the Group
implemented for all non-retail-related
functions. On a full-time equivalent basis,
the number of employees decreased
4% to 34,437 at the end of 2009 (2008:
35,977).
EBITDA declines 39%
The Group’s earnings before interest,
taxes, depreciation and amortisation of
tangible and intangible assets (EBITDA)
decreased 39% to € 780 million in 2009
(2008: € 1.280 billion) see 24. Depre-
ciation and amortisation expense for tan-
gible and intangible assets with limited
useful lives grew 28% to € 299 million in
2009 (2008: € 234 million). This develop-
ment was mainly a result of increased
fixed assets related to our own-retail
expansion and impairment losses related
to Reebok’s distribution rights in China.
In accordance with IFRS, intangible
assets with indefinite useful lives (good-
will and trademarks) are tested annually
and additionally when there are indica-
tions of potential impairment. No impair-
ment of intangible assets with unlimited
useful lives was incurred in 2009 and
2008.
Operating margin declines
5.0 percentage points
The operating margin of the adidas Group
decreased 5.0 percentage points to 4.9%
in 2009 (2008: 9.9%). The operating
margin decline was due to the decrease
in Group gross margin as well as higher
other operating expenses as a percent-
age of sales. As a result, Group operating
profit decreased 53% to € 508 million
versus € 1.070 billion in 2008 see 26.
Financial income down 49%
Financial income decreased 49% to
€ 19 million in 2009 from € 37 million
in the prior year, mainly due to changes
in the fair value of financial instruments
see Note 32, p. 202.
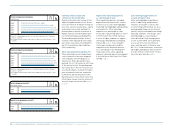
Financial expenses decrease 17%
Financial expenses decreased 17% to
€ 169 million in 2009 (2008: € 203 mil-
lion) see Note 32, p. 202. Negative
exchange rate variances were more than
compensated by lower interest expenses
see 28.
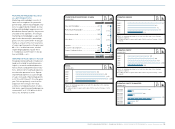
Income before taxes decreases 60%
Income before taxes (IBT) as a percent-
age of sales decreased 4.9 percentage
points to 3.5% in 2009 from 8.4% in 2008.
This was a result of the Group’s operat-
ing margin decrease. IBT for the adidas
Group declined 60% to € 358 million from
€ 904 million in 2008 see 29.
Net income attributable to
shareholders declines 62%
The Group’s net income attributable
to shareholders decreased 62% to
€ 245 million in 2009 from € 642 million
in 2008 see 31. The Group’s lower
operating profit was the primary reason
for this development. The Group’s tax
rate increased 2.7 percentage points to
31.5% in 2009 (2008: 28.8%), mainly due
to the write-down of deferred tax assets
see Note 33, p. 202.