Reebok 2009 Annual Report Download - page 139
Download and view the complete annual report
Please find page 139 of the 2009 Reebok annual report below. You can navigate through the pages in the report by either clicking on the pages listed below, or by using the keyword search tool below to find specific information within the annual report.-
 1
1 -
2
-
3
-
4
-
5
-
6
-
7
-
8
-
9
-
10
-
11
-
12
-
13
-
14
-
15
-
16
-
17
-
18
-
19
-
20
-
21
-
22
-
23
-
24
-
25
-
26
-
27
-
28
-
29
-
30
-
31
-
32
-
33
-
34
-
35
-
36
-
37
-
38
-
39
-
40
-
41
-
42
-
43
-
44
-
45
-
46
-
47
-
48
-
49
-
50
-
51
-
52
-
53
-
54
-
55
-
56
-
57
-
58
-
59
-
60
-
61
-
62
-
63
-
64
-
65
-
66
-
67
-
68
-
69
-
70
-
71
-
72
-
73
-
74
-
75
-
76
-
77
-
78
-
79
-
80
-
81
-
82
-
83
-
84
-
85
-
86
-
87
-
88
-
89
-
90
-
91
-
92
-
93
-
94
-
95
-
96
-
97
-
98
-
99
-
100
-
101
-
102
-
103
-
104
-
105
-
106
-
107
-
108
-
109
-
110
-
111
-
112
-
113
-
114
-
115
-
116
-
117
-
118
-
119
-
120
-
121
-
122
-
123
-
124
-
125
-
126
-
127
-
128
-
 129
129 -
 130
130 -
 131
131 -
 132
132 -
 133
133 -
 134
134 -
 135
135 -
 136
136 -
 137
137 -
 138
138 -
 139
139 -
 140
140 -
 141
141 -
 142
142 -
 143
143 -
 144
144 -
 145
145 -
 146
146 -
 147
147 -
 148
148 -
 149
149 -
150
-
151
-
152
-
153
-
154
-
155
-
156
-
157
-
158
-
159
-
160
-
161
-
162
-
163
-
164
-
165
-
166
-
167
-
168
-
169
-
170
-
171
-
172
-
173
-
174
-
175
-
176
-
177
-
178
-
179
-
180
-
181
-
182
-
183
-
184
-
185
-
186
-
187
-
188
-
189
-
190
-
191
-
192
-
193
-
194
-
195
-
196
-
197
-
198
-
199
-
200
-
201
-
202
-
203
-
204
-
205
-
206
-
207
-
208
-
209
-
210
-
211
-
212
-
213
-
214
-
215
-
216
-
217
-
218
-
219
-
220
-
221
-
222
-
223
-
224
-
225
-
226
-
227
-
228
-
229
-
230
-
231
-
232
-
233
-
234
 |
 |
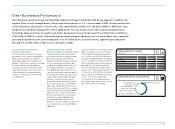
GROUP MANAGEMENT REPORT – FINANCIAL REVIEW BUSINESS PERFORMANCE BY SEGMENT Retail Business Performance 135
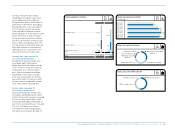
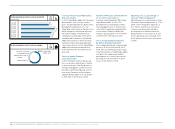
Currency translation effects had a
mixed impact on regional sales in euro
terms. Segmental sales in Western
Europe increased 5% to € 405 million in
2009 (2008: € 384 million). In European
Emerging Markets, sales increased 2%
to € 617 million versus € 606 million
in the year before. Revenues in North
America grew 5% to € 380 million in 2009
from € 363 million in 2008. In Greater
China, sales increased 66% to € 88 mil-
lion versus € 53 million in the prior year.
Sales in Other Asian Markets grew 19%
to € 286 million in 2009 (2008: € 240 mil-
lion), while revenues in Latin America
improved 41% to € 129 million in 2009
versus € 92 million in the prior year.
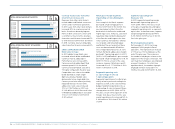
Concept store sales increase 4%
on a currency-neutral basis
Concept store revenues include sales
from adidas Sport Performance,
adidas Sport Style and Reebok concept
stores. In 2009, concept store revenues
increased 4% on a currency-neutral
basis. Sales increased at both adidas
and Reebok. In euro terms, concept
store sales increased 5% to € 833 mil-
lion in 2009 from € 791 million in 2008.
Currency-neutral comparable concept
store sales, however, declined 15%.
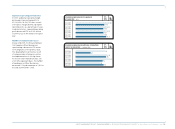
Factory outlet sales grow 5%
on a currency-neutral basis
Factory outlet revenues include sales
from adidas and Reebok factory outlets.
In 2009, factory outlet revenues increased
5% on a currency-neutral basis. Sales
increased at both adidas and Reebok. In
euro terms, factory outlet sales increased
13% to € 1.005 billion in 2009 from
€ 893 million in 2008. Comparable fac-
tory outlet sales, however, declined 1%.
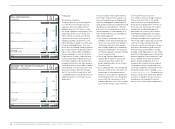
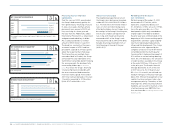
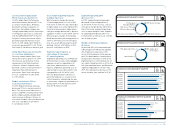
N
°-
04
RETAIL NET SALES BY REGION
15% Other Asian
Markets
20% North America
7% Latin America
21% Western Europe
32% European Emerging
Markets
5% Greater China
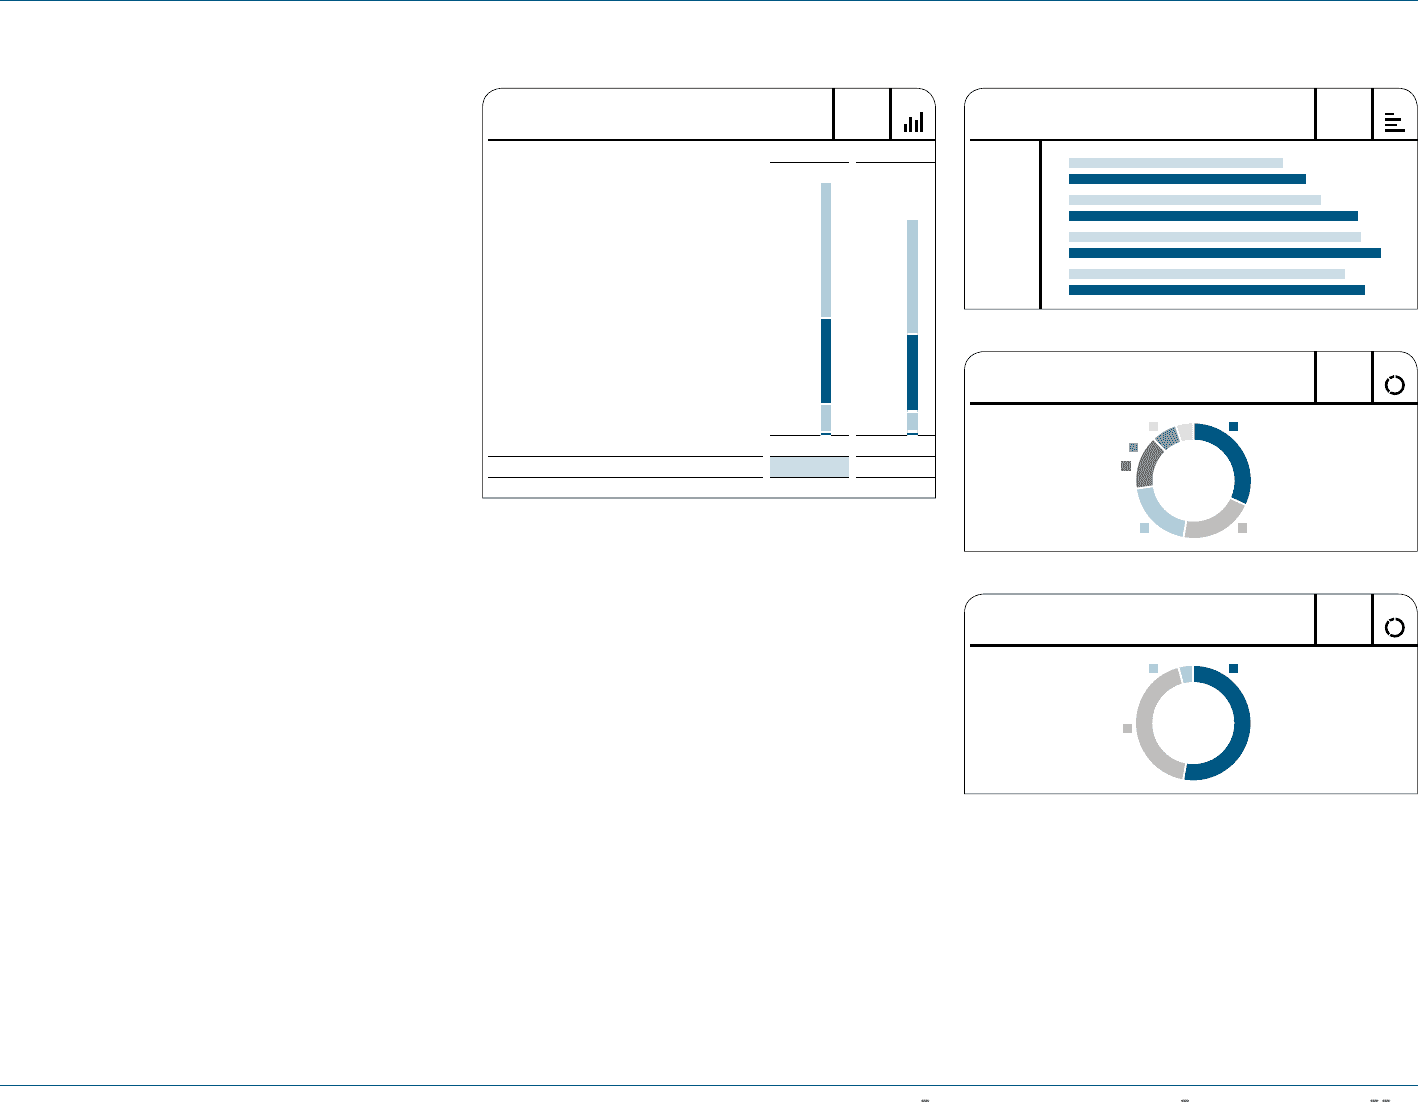
N
°-
05
RETAIL SALES BY STORE CONCEPT
4% Other formats
43% Concept stores
53% Factory outlets
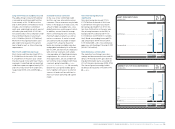
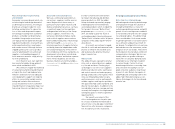
N
°-
03
RETAIL NET SALES BY QUARTER
€ IN MILLIONS
Q1 2008
Q1 2009
Q2 2008
Q2 2009
Q3 2008
Q3 2009
Q4 2008
Q4 2009
360399
423 486
491
524
464
497
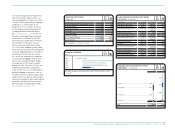
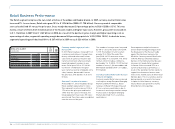
N
°-
02
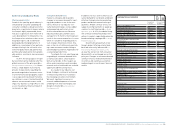
RETAIL NUMBER OF STORES
2009 2008
Total 2,212 1,884
Concept stores ...................................................1,203
681
1,019
173
11
Factory outlets ......................................................755
Other .......................................................................10
Concession corners ..............................................244