Reebok 2009 Annual Report Download - page 156
Download and view the complete annual report
Please find page 156 of the 2009 Reebok annual report below. You can navigate through the pages in the report by either clicking on the pages listed below, or by using the keyword search tool below to find specific information within the annual report.-
 1
1 -
2
-
3
-
4
-
5
-
6
-
7
-
8
-
9
-
10
-
11
-
12
-
13
-
14
-
15
-
16
-
17
-
18
-
19
-
20
-
21
-
22
-
23
-
24
-
25
-
26
-
27
-
28
-
29
-
30
-
31
-
32
-
33
-
34
-
35
-
36
-
37
-
38
-
39
-
40
-
41
-
42
-
43
-
44
-
45
-
46
-
47
-
48
-
49
-
50
-
51
-
52
-
53
-
54
-
55
-
56
-
57
-
58
-
59
-
60
-
61
-
62
-
63
-
64
-
65
-
66
-
67
-
68
-
69
-
70
-
71
-
72
-
73
-
74
-
75
-
76
-
77
-
78
-
79
-
80
-
81
-
82
-
83
-
84
-
85
-
86
-
87
-
88
-
89
-
90
-
91
-
92
-
93
-
94
-
95
-
96
-
97
-
98
-
99
-
100
-
101
-
102
-
103
-
104
-
105
-
106
-
107
-
108
-
109
-
110
-
111
-
112
-
113
-
114
-
115
-
116
-
117
-
118
-
119
-
120
-
121
-
122
-
123
-
124
-
125
-
126
-
127
-
128
-
129
-
130
-
131
-
132
-
133
-
134
-
135
-
136
-
137
-
138
-
139
-
140
-
141
-
142
-
143
-
144
-
145
-
 146
146 -
 147
147 -
 148
148 -
 149
149 -
 150
150 -
 151
151 -
 152
152 -
 153
153 -
 154
154 -
 155
155 -
 156
156 -
 157
157 -
 158
158 -
 159
159 -
 160
160 -
 161
161 -
 162
162 -
 163
163 -
 164
164 -
 165
165 -
 166
166 -
167
-
168
-
169
-
170
-
171
-
172
-
173
-
174
-
175
-
176
-
177
-
178
-
179
-
180
-
181
-
182
-
183
-
184
-
185
-
186
-
187
-
188
-
189
-
190
-
191
-
192
-
193
-
194
-
195
-
196
-
197
-
198
-
199
-
200
-
201
-
202
-
203
-
204
-
205
-
206
-
207
-
208
-
209
-
210
-
211
-
212
-
213
-
214
-
215
-
216
-
217
-
218
-
219
-
220
-
221
-
222
-
223
-
224
-
225
-
226
-
227
-
228
-
229
-
230
-
231
-
232
-
233
-
234
 |
 |

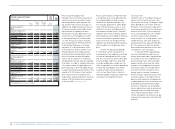
152 GROUP MANAGEMENT REPORT – FINANCIAL REVIEW Risk and Opportunity Report
Operational issues, such as poten-
tial discounts to key accounts, who
have high transparency regarding the
impacts of currency on our sourcing
activities (due to their own private
label sourcing efforts), are also
excluded from this presentation.
Utilising a centralised currency risk
management system, our Group
hedges currency needs for projected
sourcing requirements on a rolling 12-
to 24-month basis see Treasury, p. 128.
Our goal is to have the vast majority of
our hedging volume secured six months
prior to the start of a given season. In
rare instances, hedges are contracted
beyond the 24-month horizon. The Group
also largely hedges balance sheet risks.
Due to our strong global position, we
are able to minimise currency risk to a
large extent by utilising natural hedges.
Nevertheless, our net US dollar cash flow
exposure after natural hedges calculated
for 2010 was roughly € 2.3 billion at year-
end 2009, which we hedged using forward
contracts, currency options and currency
swaps see 04. Our Group’s Treasury
Policy allows us to utilise hedging instru-
ments, such as currency options or
option combinations, which provide pro-
tection while – at the same time – retain-
ing the potential to benefit from future
favourable exchange rate developments
in the financial markets.
As 2010 hedging has almost been com-
pleted, it is clear that conversion rates
on major currencies will be slightly less
favourable compared to those of 2009.
Volume forecast variances, greater cur-
rency volatility and an increasing portion
of our business in emerging markets
remain challenges with regard to cur-
rency risks in 2010. In addition, trans-
lation impacts from the conversion of
non-euro-denominated results into our
Group’s functional currency, the euro,
could lead to a material negative or posi-
tive impact on our Group’s financial per-
formance. Consequently, we believe the
likelihood of currency risk impacting our
2010 financial performance is medium,
however the potential financial impact
could be high.
Interest rate risks
Changes in market interest rates affect
future interest payments for variable-
interest liabilities. As a result, signifi-
cant interest rate increases can have an
adverse effect on the Group’s profitability,
liquidity and financial position.
In line with IFRS 7 requirements, we have
analysed the impact of changes in the
Group’s most important interest rates on
net income and shareholders’ equity. The
effect of interest rate changes on future
cash flows is excluded from this analysis.
Nevertheless, accrued interest, which
is recognised as a liability, has been
re- calculated based on the hypothetical
market interest rates as at December 31,
2009. Fair values for derivative interest
rate instruments accounted for as cash
flow hedges were then re-evaluated
based on the hypothetical market inter-
est rates with the resulting effects on
net income and equity included in the
sensitivity analysis. The fair value interest
rate risk from private placements that
are hedged with fair value hedges was
also taken into consideration. However,
the effect on the income statement from
changes in the fair values of hedged
items and hedging instruments attrib-
utable to interest rate changes was not
material. Exclusions from this analysis
are as follows:
Some fixed-rate financial instruments,
such as certificates of deposit, which
our Group values at “fair value
through profit or loss” due to the
short-term maturity of these
instruments. Potential effects due to
changes in interest rates are consid-
ered immaterial and are not recog-
nised in the sensitivity analysis.
Other fixed-rate financial instru-
ments are measured at amortised
cost. Since a change in interest rates
would not change the carrying amount
of this category of instruments, there
is no net income impact and they are
excluded from this analysis.
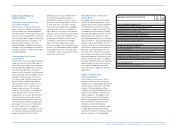
The interest rate sensitivity analysis
assumes a parallel shift of the inter-
est yield curve for all currencies and
was performed on the same basis for
both 2008 and 2009. A 100 basis point
increase in interest rates at December
31, 2009 would have increased share-
holders’ equity by € 0 million (2008:
€ 4 million) and decreased net income
by € 1 million (2008: € 1 million). A
100 basis point decrease of the interest
rates at December 31, 2009 would have
resulted in a € 0 million decrease in
shareholders’ equity (2008: € 5 million)
and a € 1 million increase in net income
(2008: € 1 million).
We believe the IFRS 7 interest rate
analysis represents a realistic if rough
estimate of our current interest rate risk.
To moderate interest rate risks
and maintain financial flexibility, a core
tenet of our Group’s financial strategy
is to continue to use surplus cash flow
from operations to reduce net borrow-
ings see Treasury, p.128. In light of the
low interest rate level in North America
and Europe, and the easing of govern-
ment fiscal action to stimulate economic
growth, the risk of upward interest rate
adjustments has increased compared to
the prior year. Therefore, we now believe
that the likelihood of a Group-wide inter-
est rate increase has risen to medium.
Nevertheless, given the increase in our
Group’s portion of longer-term fixed rate
financing in 2009, we continue to project
any potential interest rate increases as
having a low financial effect.