Reebok 2009 Annual Report Download - page 138
Download and view the complete annual report
Please find page 138 of the 2009 Reebok annual report below. You can navigate through the pages in the report by either clicking on the pages listed below, or by using the keyword search tool below to find specific information within the annual report.-
 1
1 -
2
-
3
-
4
-
5
-
6
-
7
-
8
-
9
-
10
-
11
-
12
-
13
-
14
-
15
-
16
-
17
-
18
-
19
-
20
-
21
-
22
-
23
-
24
-
25
-
26
-
27
-
28
-
29
-
30
-
31
-
32
-
33
-
34
-
35
-
36
-
37
-
38
-
39
-
40
-
41
-
42
-
43
-
44
-
45
-
46
-
47
-
48
-
49
-
50
-
51
-
52
-
53
-
54
-
55
-
56
-
57
-
58
-
59
-
60
-
61
-
62
-
63
-
64
-
65
-
66
-
67
-
68
-
69
-
70
-
71
-
72
-
73
-
74
-
75
-
76
-
77
-
78
-
79
-
80
-
81
-
82
-
83
-
84
-
85
-
86
-
87
-
88
-
89
-
90
-
91
-
92
-
93
-
94
-
95
-
96
-
97
-
98
-
99
-
100
-
101
-
102
-
103
-
104
-
105
-
106
-
107
-
108
-
109
-
110
-
111
-
112
-
113
-
114
-
115
-
116
-
117
-
118
-
119
-
120
-
121
-
122
-
123
-
124
-
125
-
126
-
127
-
 128
128 -
 129
129 -
 130
130 -
 131
131 -
 132
132 -
 133
133 -
 134
134 -
 135
135 -
 136
136 -
 137
137 -
 138
138 -
 139
139 -
 140
140 -
 141
141 -
 142
142 -
 143
143 -
 144
144 -
 145
145 -
 146
146 -
 147
147 -
 148
148 -
149
-
150
-
151
-
152
-
153
-
154
-
155
-
156
-
157
-
158
-
159
-
160
-
161
-
162
-
163
-
164
-
165
-
166
-
167
-
168
-
169
-
170
-
171
-
172
-
173
-
174
-
175
-
176
-
177
-
178
-
179
-
180
-
181
-
182
-
183
-
184
-
185
-
186
-
187
-
188
-
189
-
190
-
191
-
192
-
193
-
194
-
195
-
196
-
197
-
198
-
199
-
200
-
201
-
202
-
203
-
204
-
205
-
206
-
207
-
208
-
209
-
210
-
211
-
212
-
213
-
214
-
215
-
216
-
217
-
218
-
219
-
220
-
221
-
222
-
223
-
224
-
225
-
226
-
227
-
228
-
229
-
230
-
231
-
232
-
233
-
234
 |
 |
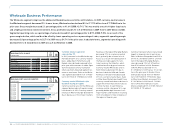
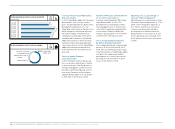
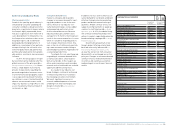
134 GROUP MANAGEMENT REPORT – FINANCIAL REVIEW BUSINESS PERFORMANCE BY SEGMENT Retail Business Performance
Retail Business Performance
The Retail segment comprises the own-retail activities of the adidas and Reebok brands. In 2009, currency-neutral Retail sales
increased 7%. In euro terms, Retail sales grew 10% to € 1.906 billion (2008: € 1.738 billion). Currency-neutral comparable
store sales declined 6% versus the prior year. Gross margin decreased 2.9 percentage points to 58.6% (2008: 61.5%). This was
mainly a result of effects from the devaluation of the Russian rouble and higher input costs. However, gross profit increased 4%
to € 1.116 billion in 2009 from € 1.069 billion in 2008. As a result of the decline in gross margin and higher operating costs as
a percentage of sales, segmental operating margin decreased 4.8 percentage points to 14.0% (2008: 18.8%). In absolute terms,
segmental operating profit declined 18% to € 267 million in 2009 versus € 326 million in 2008.
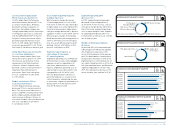
Currency-neutral segmental sales
increase 7%
In 2009, Retail revenues increased 7% on
a currency-neutral basis. Concept store,
factory outlet and other retail format
sales were all up versus the prior year.
Currency translation effects positively
impacted segment revenues in euro
terms. Sales grew 10% to € 1.906 bil-
lion from € 1.738 billion in the prior
year. Currency-neutral comparable store
sales, however, decreased 6% versus
the prior year, with declines in all store
formats.
Own-retail store base increases
At December 31, 2009, the adidas Group
Retail segment operated 2,212 stores.
This represents a net increase of 328 or
17% versus the prior year-end level of
1,884. Over the course of the year, the
Group opened 416 new stores. 88 stores
were closed. Two stores were remodelled
over the course of the year.
The number of concept stores increased
by 184 to 1,203 at the end of 2009 (2008:
1,019). The number of factory outlets
grew by 74 to 755 at the end of the
year (2008: 681). Concession corners
increased by 71 to 244 (2008: 173). Other
formats, which include e-commerce,
declined by 1 to 10 (2008: 11). Of the total
number of stores, 1,626 were adidas and
586 Reebok branded (2008: 1,311 adidas,
573 Reebok).
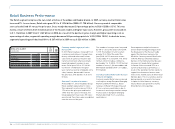
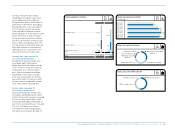
Currency-neutral Retail sales increase
in nearly all regions
Currency-neutral Retail sales increased
in all regions except European Emerging
Markets and North America. Retail
revenues in Western Europe increased
8% on a currency-neutral basis due to
increases in most major markets except
France. Sales in European Emerging
Markets declined 1% on a currency-
neutral basis.
Store expansion and price increases
almost offset the negative impact from
the devaluation of the Russian rouble
against the functional currency, the
US dollar. Currency-neutral Retail sales
in North America remained stable as
declines in the USA were offset by sales
increases in Canada. Retail revenues
in Greater China increased 57% on a
currency-neutral basis primarily as a
result of the opening of factory outlets to
support the clearance of excess inven-
tories in this market. Sales in Other Asian
Markets grew 11% on a currency-neutral
basis primarily as a result of increases
in Japan. In Latin America, currency-
neutral Retail sales grew 51%, mainly
driven by new store openings.
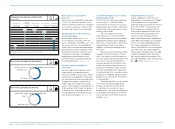
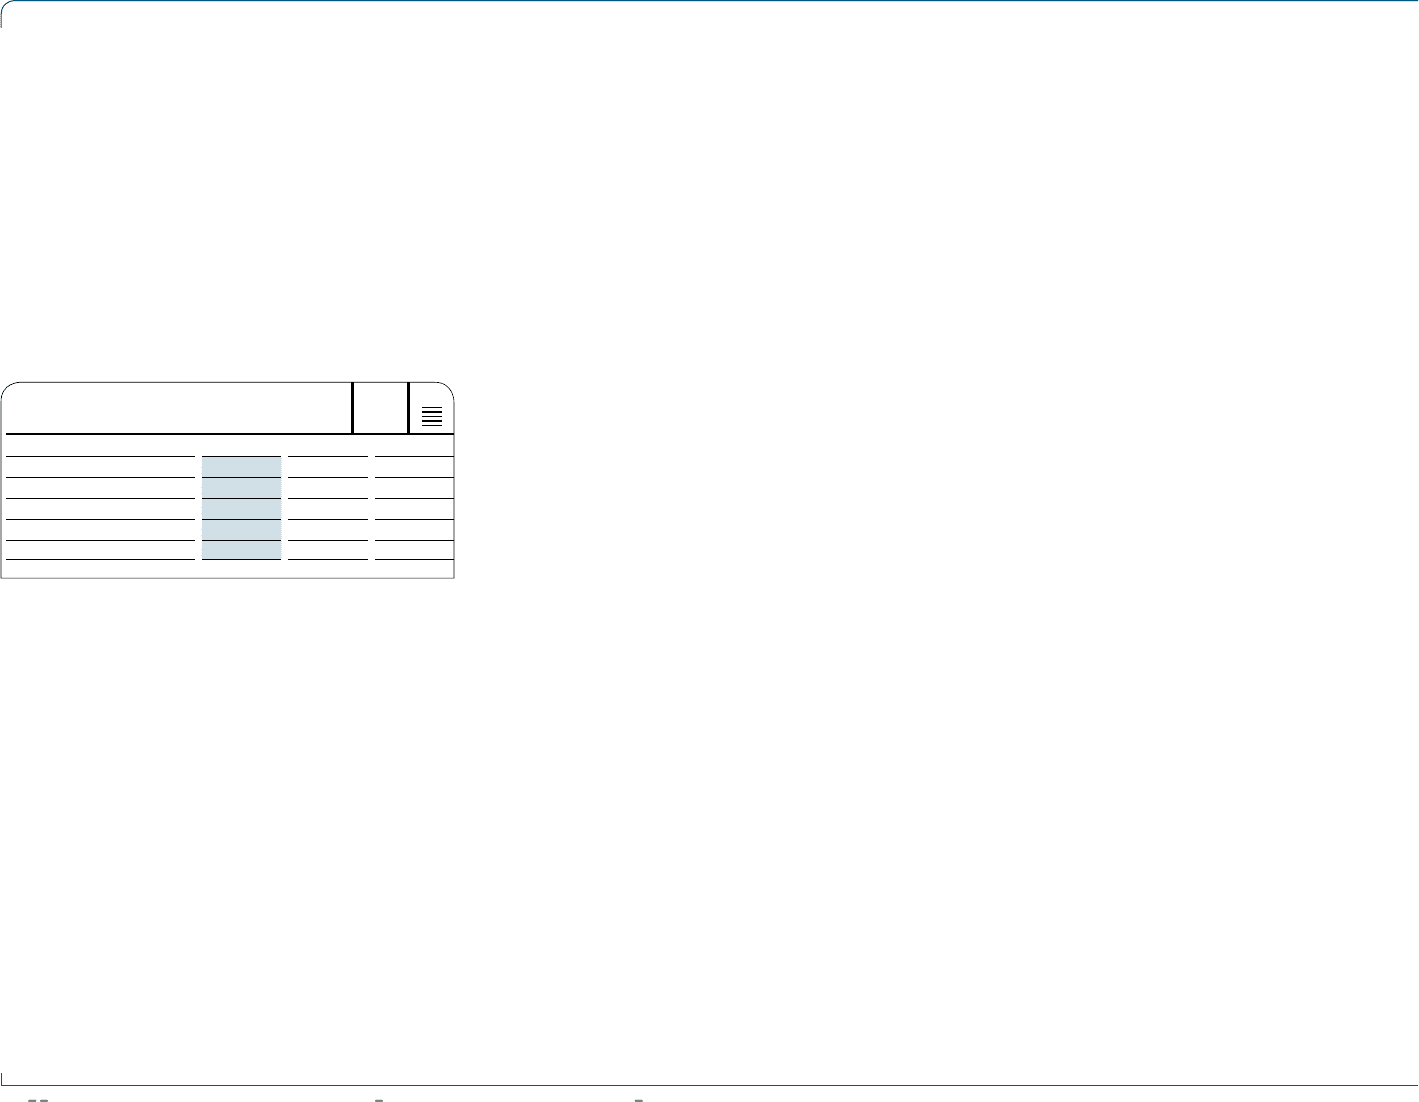
N
°-
01
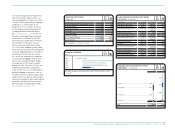
RETAIL AT A GLANCE
€ IN MILLIONS
2009 2008 Change
Net sales 1,906 1,738 10%
Gross profit 1,116 1,069 4%
Gross margin 58.6% 61.5% (2.9pp)
Segmental operating profit 267 326 (18%)
Segmental operating margin 14.0% 18.8% (4.8pp)