Reebok 2009 Annual Report Download - page 215
Download and view the complete annual report
Please find page 215 of the 2009 Reebok annual report below. You can navigate through the pages in the report by either clicking on the pages listed below, or by using the keyword search tool below to find specific information within the annual report.-
 1
1 -
2
-
3
-
4
-
5
-
6
-
7
-
8
-
9
-
10
-
11
-
12
-
13
-
14
-
15
-
16
-
17
-
18
-
19
-
20
-
21
-
22
-
23
-
24
-
25
-
26
-
27
-
28
-
29
-
30
-
31
-
32
-
33
-
34
-
35
-
36
-
37
-
38
-
39
-
40
-
41
-
42
-
43
-
44
-
45
-
46
-
47
-
48
-
49
-
50
-
51
-
52
-
53
-
54
-
55
-
56
-
57
-
58
-
59
-
60
-
61
-
62
-
63
-
64
-
65
-
66
-
67
-
68
-
69
-
70
-
71
-
72
-
73
-
74
-
75
-
76
-
77
-
78
-
79
-
80
-
81
-
82
-
83
-
84
-
85
-
86
-
87
-
88
-
89
-
90
-
91
-
92
-
93
-
94
-
95
-
96
-
97
-
98
-
99
-
100
-
101
-
102
-
103
-
104
-
105
-
106
-
107
-
108
-
109
-
110
-
111
-
112
-
113
-
114
-
115
-
116
-
117
-
118
-
119
-
120
-
121
-
122
-
123
-
124
-
125
-
126
-
127
-
128
-
129
-
130
-
131
-
132
-
133
-
134
-
135
-
136
-
137
-
138
-
139
-
140
-
141
-
142
-
143
-
144
-
145
-
146
-
147
-
148
-
149
-
150
-
151
-
152
-
153
-
154
-
155
-
156
-
157
-
158
-
159
-
160
-
161
-
162
-
163
-
164
-
165
-
166
-
167
-
168
-
169
-
170
-
171
-
172
-
173
-
174
-
175
-
176
-
177
-
178
-
179
-
180
-
181
-
182
-
183
-
184
-
185
-
186
-
187
-
188
-
189
-
190
-
191
-
192
-
193
-
194
-
195
-
196
-
197
-
198
-
199
-
200
-
201
-
202
-
203
-
204
-
 205
205 -
 206
206 -
 207
207 -
 208
208 -
 209
209 -
 210
210 -
 211
211 -
 212
212 -
 213
213 -
 214
214 -
 215
215 -
 216
216 -
 217
217 -
 218
218 -
 219
219 -
 220
220 -
 221
221 -
 222
222 -
 223
223 -
 224
224 -
 225
225 -
226
-
227
-
228
-
229
-
230
-
231
-
232
-
233
-
234
 |
 |
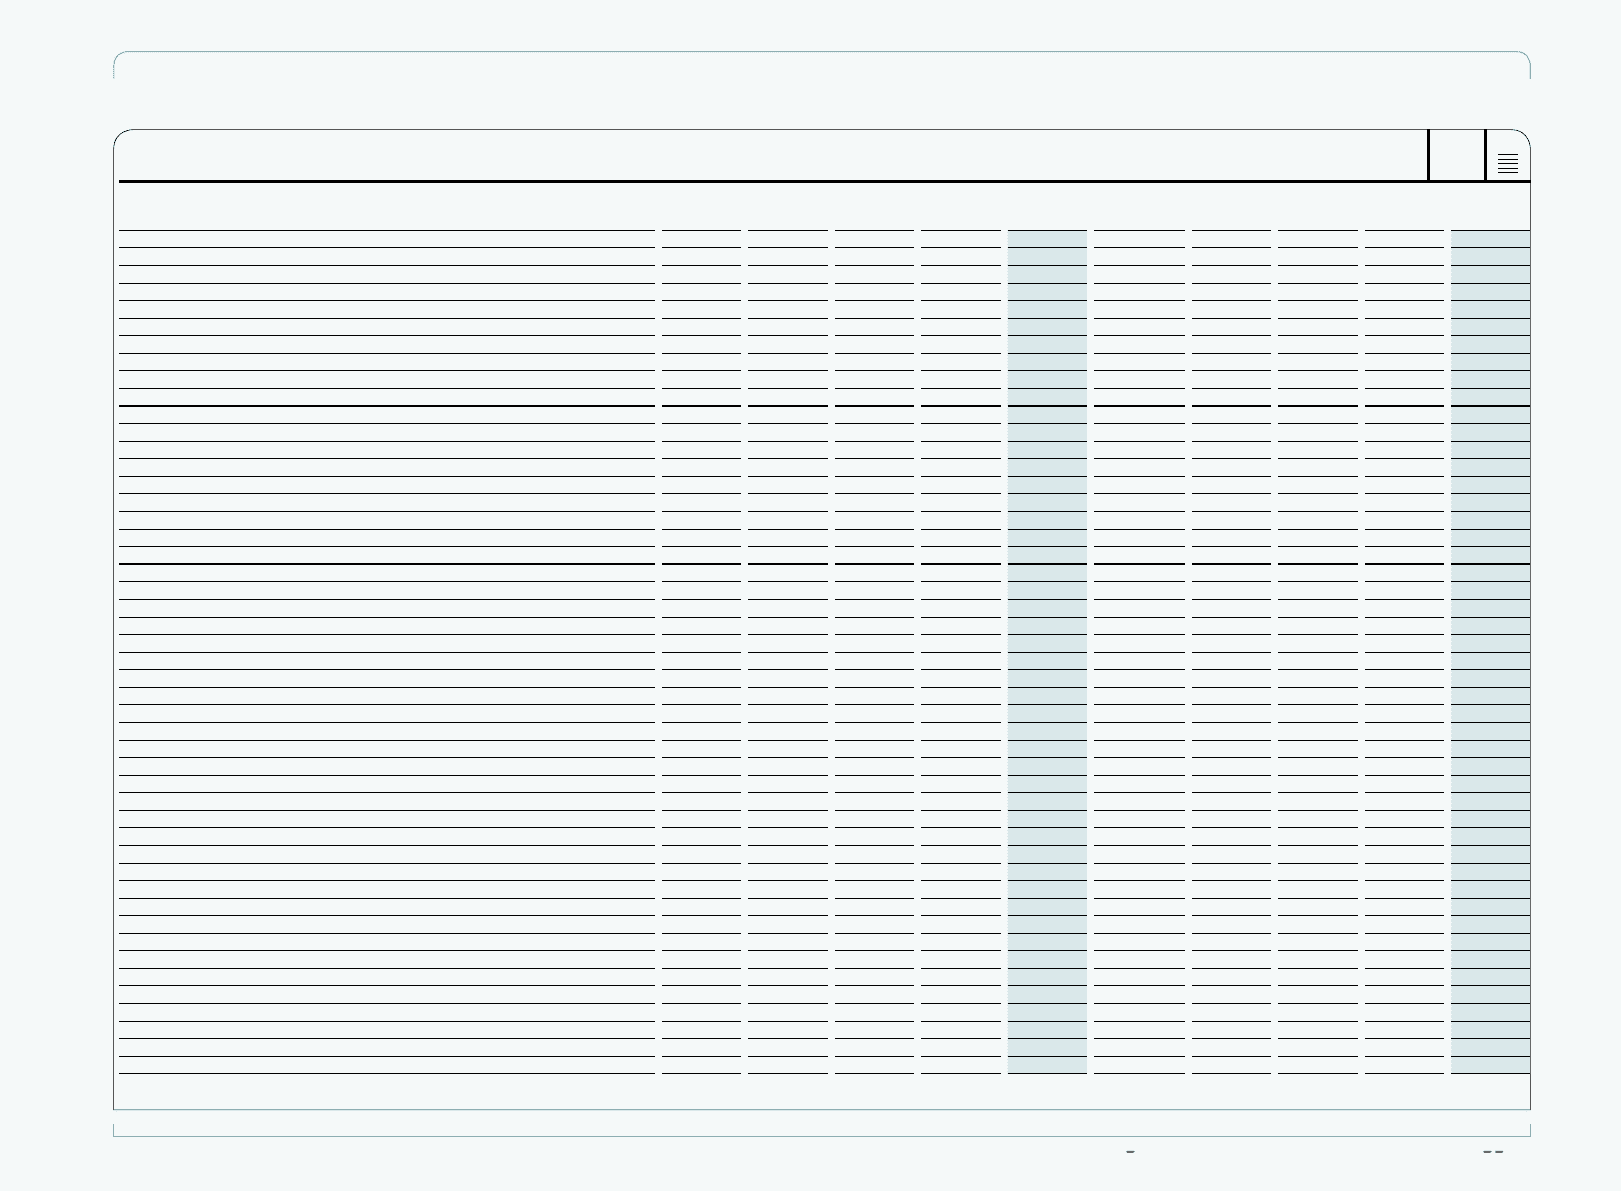
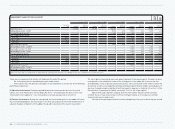
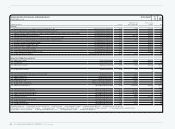
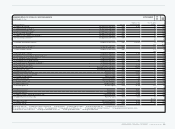
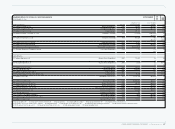
CONSOLIDATED FINANCIAL STATEMENTS Statement of Movements of Intangible and Tangible Assets 211
N
°-
I
STATEMENT OF MOVEMENTS OF INTANGIBLE AND TANGIBLE ASSETS ATTACHMENT
€ IN MILLIONS
Goodwill Trademarks
Software,
patents and
concessions
Internally
generated
software
Total
intangible
assets
Land and build-
ings/leasehold
improvements
Technical
equipment and
machinery
Other equip-
ment, furniture
and fittings Construction in
progress
Total
tangible
assets
Acquisition cost
January 1, 2008 1,436 1,291 441 — 3,169 430 115 629 42 1,216
Currency effect 45 75 12 — 131 5 (4) 2 3 7
Additions 0 0 59 1 60 21 17 183 94 316
Increase in companies consolidated 18 27 20 — 65 12 4 8 — 23
Transfers from assets held for sale — — — — — 44 — 5 — 49
Transfers to assets held for sale — (3) (0) — (4) (6) — (1) — (7)
Decrease in companies consolidated — — — — — — — — — —
Transfers — — (10) — (10) 10 14 58 (72) 10
Disposals — 0 (6) — (6) (27) (6) (36) (2) (71)
December 31, 2008/January 1, 2009 1,499 1,390 516 1 3,406 489 140 847 66 1,542
Currency effect (26) (48) (7) — (81) (7) (1) (3) (1) (13)
Additions 1 0 48 0 50 17 4 101 72 195
Increase in companies consolidated 4 — 0 — 4 — 0 6 — 6
Transfers from assets held for sale — — — — — 4 2 1 — 7
Transfers to assets held for sale — — — — — (126) — — — (126)
Decrease in companies consolidated 0 — — — 0 — — — — —
Transfers — — 2 1 3 28 28 6 (65) (3)
Disposals — — (24) (0) (25) (25) (19) (82) (2) (128)
December 31, 2009 1,478 1,342 535 3 3,358 380 156 876 69 1,480
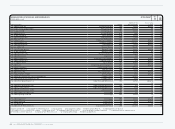
Accumulated depreciation/amortisation
January 1, 2008 — — 247 — 247 92 44 378 — 514
Currency effect — — 10 — 10 2 — 7 — 9
Additions — — 61 0 61 25 15 124 — 165
Impairment — — — — — 1 (0) 5 — 6
Write-ups — — — — — — — — — —
Increase in companies consolidated — — — — — — — — — —
Transfers from assets held for sale — — — — — 3 — 2 — 5
Transfers to assets held for sale — — — — — — — — — —
Decrease in companies consolidated — — — — — — — — — —
Transfers — — — — — (1) (3) 4 — —
Disposals — — (4) — (4) (8) (6) (29) — (42)
December 31, 2008/January 1, 2009 — — 313 0 313 116 50 490 — 656
Currency effect — — (6) — (6) (2) (1) (6) — (9)
Additions — 0 65 1 66 32 20 147 — 198
Impairment — — 19 — 19 6 0 10 — 16
Write-ups — — 0 — 0 — — (0) — (0)
Increase in companies consolidated — — — — — — — 1 — 1
Transfers from assets held for sale — — — — — 2 2 1 — 5
Transfers to assets held for sale — — — — — (20) — — — (20)
Decrease in companies consolidated — — — — — — — — — —
Transfers — — 0 — 0 (1) (0) 1 — (0)
Disposals — — (16) (0) (16) (9) (16) (65) — (89)
December 31, 2009 — 0 377 0 377 123 55 579 — 757
Net carrying amount
December 31, 2007 1,436 1,291 194 — 2,922 338 71 251 42 702
December 31, 2008 1,499 1,390 202 2 3,093 373 90 357 66 886
December 31, 2009 1,478 1,342 158 2 2,980 257 101 297 69 723
Rounding differences may arise in percentages and totals.