Reebok 2009 Annual Report Download - page 155
Download and view the complete annual report
Please find page 155 of the 2009 Reebok annual report below. You can navigate through the pages in the report by either clicking on the pages listed below, or by using the keyword search tool below to find specific information within the annual report.-
 1
1 -
2
-
3
-
4
-
5
-
6
-
7
-
8
-
9
-
10
-
11
-
12
-
13
-
14
-
15
-
16
-
17
-
18
-
19
-
20
-
21
-
22
-
23
-
24
-
25
-
26
-
27
-
28
-
29
-
30
-
31
-
32
-
33
-
34
-
35
-
36
-
37
-
38
-
39
-
40
-
41
-
42
-
43
-
44
-
45
-
46
-
47
-
48
-
49
-
50
-
51
-
52
-
53
-
54
-
55
-
56
-
57
-
58
-
59
-
60
-
61
-
62
-
63
-
64
-
65
-
66
-
67
-
68
-
69
-
70
-
71
-
72
-
73
-
74
-
75
-
76
-
77
-
78
-
79
-
80
-
81
-
82
-
83
-
84
-
85
-
86
-
87
-
88
-
89
-
90
-
91
-
92
-
93
-
94
-
95
-
96
-
97
-
98
-
99
-
100
-
101
-
102
-
103
-
104
-
105
-
106
-
107
-
108
-
109
-
110
-
111
-
112
-
113
-
114
-
115
-
116
-
117
-
118
-
119
-
120
-
121
-
122
-
123
-
124
-
125
-
126
-
127
-
128
-
129
-
130
-
131
-
132
-
133
-
134
-
135
-
136
-
137
-
138
-
139
-
140
-
141
-
142
-
143
-
144
-
 145
145 -
 146
146 -
 147
147 -
 148
148 -
 149
149 -
 150
150 -
 151
151 -
 152
152 -
 153
153 -
 154
154 -
 155
155 -
 156
156 -
 157
157 -
 158
158 -
 159
159 -
 160
160 -
 161
161 -
 162
162 -
 163
163 -
 164
164 -
 165
165 -
166
-
167
-
168
-
169
-
170
-
171
-
172
-
173
-
174
-
175
-
176
-
177
-
178
-
179
-
180
-
181
-
182
-
183
-
184
-
185
-
186
-
187
-
188
-
189
-
190
-
191
-
192
-
193
-
194
-
195
-
196
-
197
-
198
-
199
-
200
-
201
-
202
-
203
-
204
-
205
-
206
-
207
-
208
-
209
-
210
-
211
-
212
-
213
-
214
-
215
-
216
-
217
-
218
-
219
-
220
-
221
-
222
-
223
-
224
-
225
-
226
-
227
-
228
-
229
-
230
-
231
-
232
-
233
-
234
 |
 |
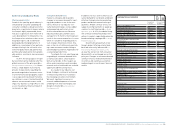
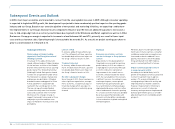
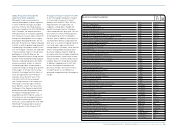
GROUP MANAGEMENT REPORT – FINANCIAL REVIEW Risk and Opportunity Report 151
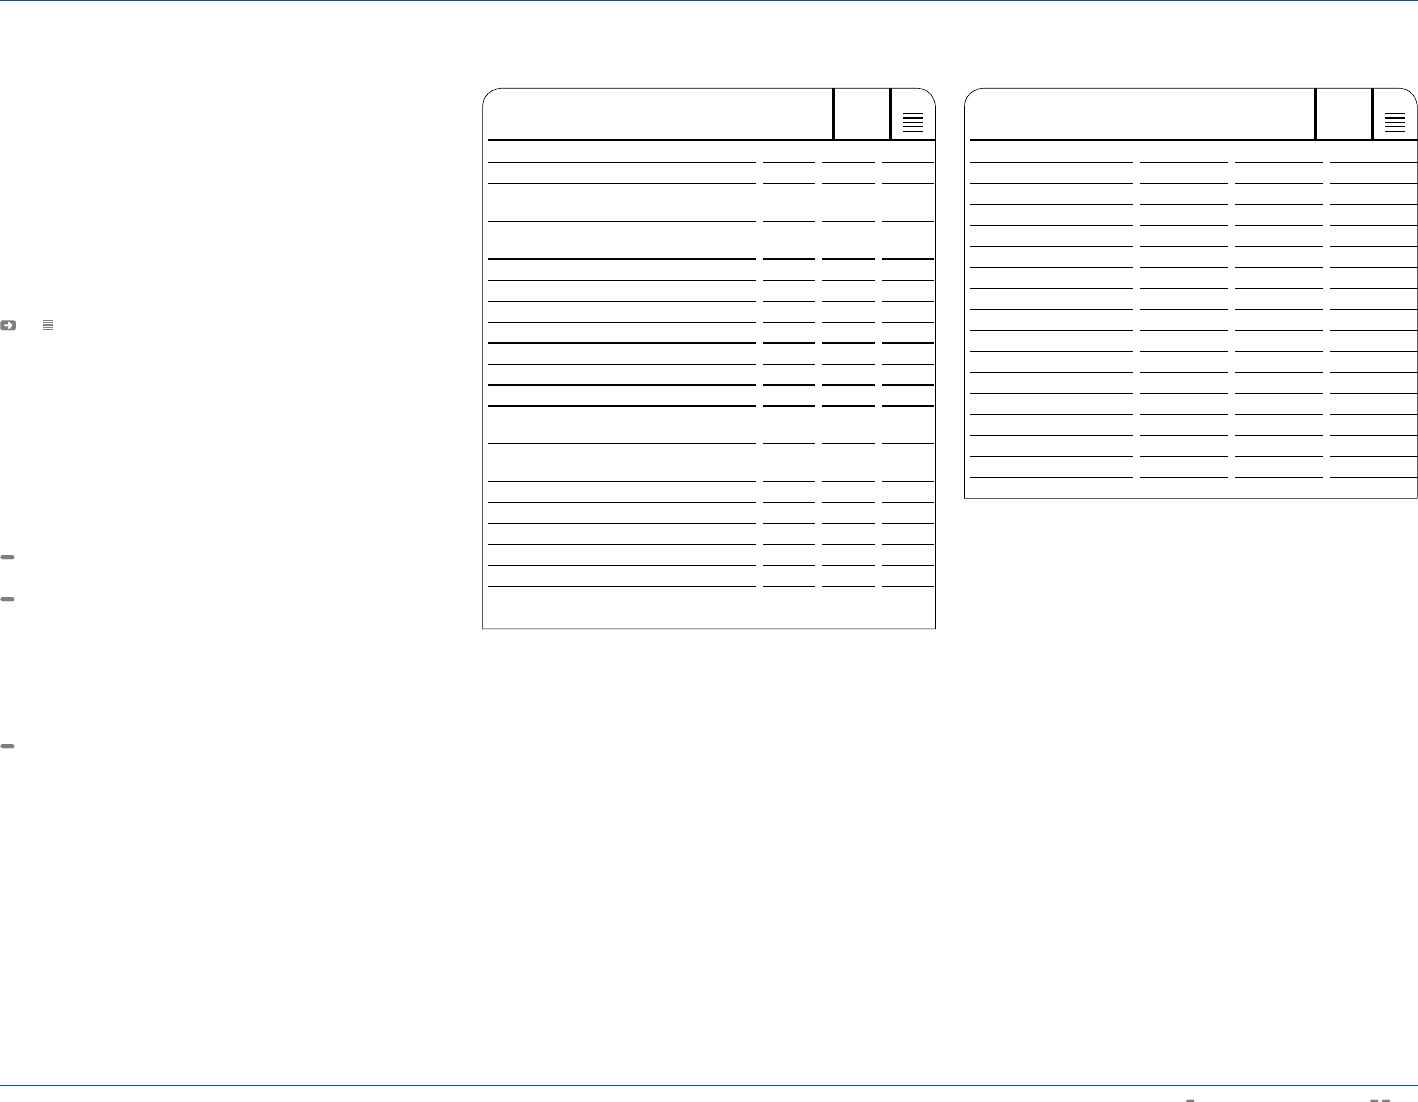
Based on this analysis, a 10% increase
in the euro versus the US dollar at
December 31, 2009 would have led to a
€ 1 million increase in net income. The
more negative market values of the US
dollar hedges would have decreased
shareholders’ equity by € 144 million. A
10% weaker euro at December 31, 2009
would have led to a € 1 million decrease
in net income. Shareholders’ equity
would have increased by € 176 million
see 05. The impacts of fluctuations of
the euro against the British pound and of
the US dollar against the Japanese yen
on net income and shareholders’ equity
are also included in accordance with IFRS
requirements.
However, many other financial and
operational variables that could poten-
tially reduce the effect of currency fluc-
tuations are excluded from the analysis.
These include:
Interest rates and all other exchange
rates are assumed constant.
Exchange rates are assumed at a
year-end value instead of the more
relevant sales-weighted average
figure, which we utilise internally to
better reflect both the seasonality of
our business and intra-year currency
fluctuations.
The underlying forecasted cash flow
exposure (which the hedge instrument
mainly relates to) is not required to be
revalued in this analysis.
N
°-
05
SENSITIVITY ANALYSIS OF FOREIGN EXCHANGE
RATE CHANGES € IN MILLIONS
USD GBP JPY
As at December 31, 2009
EUR +10% EUR +10% USD +10%
Equity (144) 21 13
Net income 1 (1) 0
EUR –10% EUR –10% USD –10%
Equity 176 (25) (13)
Net income (1) 1 (1)
As at December 31, 2008
EUR +10% EUR +10% USD +10%
Equity (108) 17 22
Net income 10 (1) (1)
EUR –10% EUR –10% USD –10%
Equity 133 (20) (21)
Net income (13) 0 1
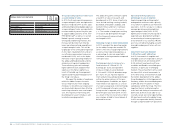
N
°-
04
EXPOSURE TO FOREIGN EXCHANGE RISK 1 )
BASED ON NOTIONAL AMOUNTS, € IN MILLIONS
USD GBP JPY
As at December 31, 2009
Exposure from firm commitments
and forecasted transactions (2,320) 237 199
Balance sheet exposure including
intercompany exposure (74) 7 0
Total gross exposure (2,394) 245 200
Hedged with other cash flows 150 — —
Hedged with currency options 532 — (6)
Hedged with forward contracts 1,659 (260) (120)
Net exposure (53) (15) 73
As at December 31, 2008
Exposure from firm commitments
and forecasted transactions (2,341) 323 339
Balance sheet exposure including
intercompany exposure (192) (24) (7)
Total gross exposure (2,533) 299 332
Hedged with other cash flows 83 — —
Hedged with currency options 457 (25) (57)
Hedged with forward contracts 1,294 (197) (185)
Net exposure (699) 77 90
1) Rounding differences may arise in totals.