Reebok 2009 Annual Report Download - page 192
Download and view the complete annual report
Please find page 192 of the 2009 Reebok annual report below. You can navigate through the pages in the report by either clicking on the pages listed below, or by using the keyword search tool below to find specific information within the annual report.-
 1
1 -
2
-
3
-
4
-
5
-
6
-
7
-
8
-
9
-
10
-
11
-
12
-
13
-
14
-
15
-
16
-
17
-
18
-
19
-
20
-
21
-
22
-
23
-
24
-
25
-
26
-
27
-
28
-
29
-
30
-
31
-
32
-
33
-
34
-
35
-
36
-
37
-
38
-
39
-
40
-
41
-
42
-
43
-
44
-
45
-
46
-
47
-
48
-
49
-
50
-
51
-
52
-
53
-
54
-
55
-
56
-
57
-
58
-
59
-
60
-
61
-
62
-
63
-
64
-
65
-
66
-
67
-
68
-
69
-
70
-
71
-
72
-
73
-
74
-
75
-
76
-
77
-
78
-
79
-
80
-
81
-
82
-
83
-
84
-
85
-
86
-
87
-
88
-
89
-
90
-
91
-
92
-
93
-
94
-
95
-
96
-
97
-
98
-
99
-
100
-
101
-
102
-
103
-
104
-
105
-
106
-
107
-
108
-
109
-
110
-
111
-
112
-
113
-
114
-
115
-
116
-
117
-
118
-
119
-
120
-
121
-
122
-
123
-
124
-
125
-
126
-
127
-
128
-
129
-
130
-
131
-
132
-
133
-
134
-
135
-
136
-
137
-
138
-
139
-
140
-
141
-
142
-
143
-
144
-
145
-
146
-
147
-
148
-
149
-
150
-
151
-
152
-
153
-
154
-
155
-
156
-
157
-
158
-
159
-
160
-
161
-
162
-
163
-
164
-
165
-
166
-
167
-
168
-
169
-
170
-
171
-
172
-
173
-
174
-
175
-
176
-
177
-
178
-
179
-
180
-
181
-
 182
182 -
 183
183 -
 184
184 -
 185
185 -
 186
186 -
 187
187 -
 188
188 -
 189
189 -
 190
190 -
 191
191 -
 192
192 -
 193
193 -
 194
194 -
 195
195 -
 196
196 -
 197
197 -
 198
198 -
 199
199 -
 200
200 -
 201
201 -
 202
202 -
203
-
204
-
205
-
206
-
207
-
208
-
209
-
210
-
211
-
212
-
213
-
214
-
215
-
216
-
217
-
218
-
219
-
220
-
221
-
222
-
223
-
224
-
225
-
226
-
227
-
228
-
229
-
230
-
231
-
232
-
233
-
234
 |
 |

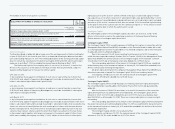
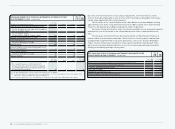
188 CONSOLIDATED FINANCIAL STATEMENTS Notes
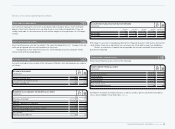
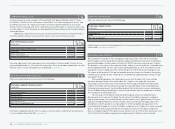
The actuarial assumptions for withdrawal rate and mortality are based on statistical information
available in the various countries, the latter for Germany on the Heubeck 2005 G mortality tables.
The Group recognises actuarial gains or losses arising in defined benefit plans during the
financial year immediately outside the income statement in the consolidated statement of compre-
hensive income. The actuarial losses recognised in this statement for 2009 amount to € 16 million
(2008: positive € 3 million). The accumulated actuarial losses recognised amount to € 25 million
(2008: € 9 million) see also Note 26.
The expected return on plan assets assumption is set separately for the various benefit
plans. The expected return on plan assets is determined for each asset category separately and
generally based on capital market research and forecasted returns. The expected return on plan
assets for the funded benefit plan in Germany is based on the overall surplus sharing of the
underlying insurance contracts.
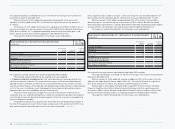
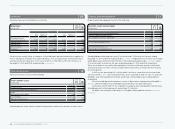
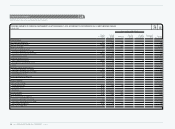
N
°-
23
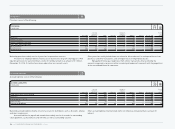
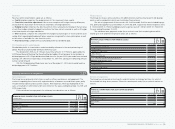
PENSION EXPENSES FOR DEFINED BENEFIT PLANS
€ IN MILLIONS
Year ending
Dec. 31, 2009 Year ending
Dec. 31, 2008
Current service cost 11 12
Interest cost 10 9
Expected return on plan assets (3) (4)
Pension expenses 18 17
Of the total pension expenses, an amount of € 13 million (2008: € 12 million) relates to employees
in Germany. The pension expense is recorded within the other operating expenses whereas the
production-related part thereof is recognised within the cost of sales.
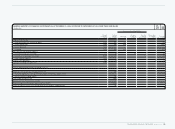
N
°-
23
DEFINED BENEFIT OBLIGATION
€ IN MILLIONS
2009 2008
Defined benefit obligation as at January 1 172 171
Currency translation differences 3 (4)
Current service cost 11 12
Interest cost 10 9
Contribution by plan participants 0 1
Pensions paid (8) (6)
Actuarial loss/(gain) 19 (11)
Defined benefit obligation as at December 31 207 172
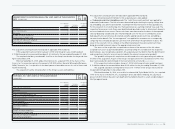
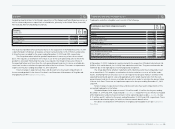
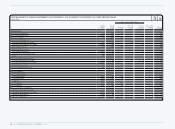
N
°-
23
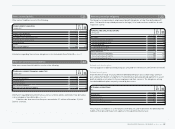
STATUS OF FUNDED AND UNFUNDED OBLIGATIONS
€ IN MILLIONS
Dec. 31, 2009 Dec. 31, 2008
Present value of unfunded obligation 144 120
Present value of funded obligation 63 52
Present value of total obligations 207 172
Fair value of plan assets (61) (53)
Asset ceiling effect 2 —
Recognised net liability for defined benefit obligations 148 119
thereof defined benefit liability 150 124
thereof defined benefit asset (2) (5)
The asset ceiling effect arises from the German funded defined benefit plan and is recognised in
the consolidated statement of comprehensive income.
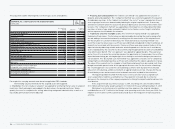
The calculations of assets and liabilities recognised from defined benefit plans are based
upon statistical and actuarial valuations. In particular, the present value of the defined benefit
obligation is driven by financial variables (such as the discount rates or future benefit increases)
and demographic variables (such as mortality and withdrawal rate). The actuarial assumptions
may differ significantly from the actual experience, i.e. the present value of the benefits actually
provided in future may differ from the amount reported.
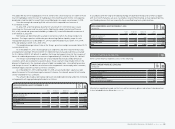
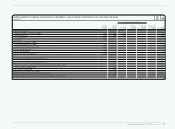
N
°-
23
MOVEMENT IN PLAN ASSETS
€ IN MILLIONS
2009 2008
Fair value of plan assets at January 1 53 60
Currency translation differences 2 (5)
Pensions paid (3) (2)
Contributions by the employer 3 3
Contributions paid by plan participants 0 1
Actuarial gain/(loss) 3 (8)
Expected return on plan assets 3 4
Fair value of plan assets at December 31 61 53
In 2010, the expected payments amount to € 9 million. Thereof € 7 million relate to benefits paid
immediately by the company and contributions paid by the company into plan assets amount to
€ 2 million. In 2009, the actual return on plan assets is € 6 million (2008: negative € 4 million).