Reebok 2009 Annual Report Download - page 210
Download and view the complete annual report
Please find page 210 of the 2009 Reebok annual report below. You can navigate through the pages in the report by either clicking on the pages listed below, or by using the keyword search tool below to find specific information within the annual report.-
 1
1 -
2
-
3
-
4
-
5
-
6
-
7
-
8
-
9
-
10
-
11
-
12
-
13
-
14
-
15
-
16
-
17
-
18
-
19
-
20
-
21
-
22
-
23
-
24
-
25
-
26
-
27
-
28
-
29
-
30
-
31
-
32
-
33
-
34
-
35
-
36
-
37
-
38
-
39
-
40
-
41
-
42
-
43
-
44
-
45
-
46
-
47
-
48
-
49
-
50
-
51
-
52
-
53
-
54
-
55
-
56
-
57
-
58
-
59
-
60
-
61
-
62
-
63
-
64
-
65
-
66
-
67
-
68
-
69
-
70
-
71
-
72
-
73
-
74
-
75
-
76
-
77
-
78
-
79
-
80
-
81
-
82
-
83
-
84
-
85
-
86
-
87
-
88
-
89
-
90
-
91
-
92
-
93
-
94
-
95
-
96
-
97
-
98
-
99
-
100
-
101
-
102
-
103
-
104
-
105
-
106
-
107
-
108
-
109
-
110
-
111
-
112
-
113
-
114
-
115
-
116
-
117
-
118
-
119
-
120
-
121
-
122
-
123
-
124
-
125
-
126
-
127
-
128
-
129
-
130
-
131
-
132
-
133
-
134
-
135
-
136
-
137
-
138
-
139
-
140
-
141
-
142
-
143
-
144
-
145
-
146
-
147
-
148
-
149
-
150
-
151
-
152
-
153
-
154
-
155
-
156
-
157
-
158
-
159
-
160
-
161
-
162
-
163
-
164
-
165
-
166
-
167
-
168
-
169
-
170
-
171
-
172
-
173
-
174
-
175
-
176
-
177
-
178
-
179
-
180
-
181
-
182
-
183
-
184
-
185
-
186
-
187
-
188
-
189
-
190
-
191
-
192
-
193
-
194
-
195
-
196
-
197
-
198
-
199
-
 200
200 -
 201
201 -
 202
202 -
 203
203 -
 204
204 -
 205
205 -
 206
206 -
 207
207 -
 208
208 -
 209
209 -
 210
210 -
 211
211 -
 212
212 -
 213
213 -
 214
214 -
 215
215 -
 216
216 -
 217
217 -
 218
218 -
 219
219 -
 220
220 -
221
-
222
-
223
-
224
-
225
-
226
-
227
-
228
-
229
-
230
-
231
-
232
-
233
-
234
 |
 |
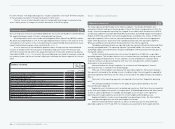
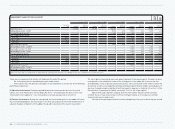
206 CONSOLIDATED FINANCIAL STATEMENTS Notes
N
°-
35
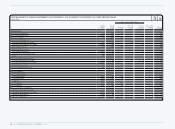
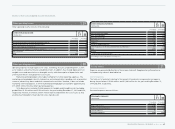
TOTAL SEGMENTAL ASSETS
€ IN MILLIONS
Dec. 31, 2009 Dec. 31, 2008
Total segmental assets 2,787 3,406
Non-segmental accounts receivable and inventories 113 213
Current financial assets 1,010 672
Other current assets 575 643
Non-current assets 4,390 4,599
Total assets 8,875 9,533
N
°-
35
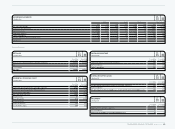
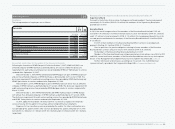
TOTAL SEGMENTAL LIABILITIES
€ IN MILLIONS
Dec. 31, 2009 Dec. 31, 2008
Total segmental liabilities 581 586
Non-segmental accounts payable 585 632
Current financial liabilities 299 876
Other current liabilities 1,371 1,551
Non-current liabilities 2,263 2,488
Total liabilities 5,099 6,133
Product Information Product Information
N
°-
35
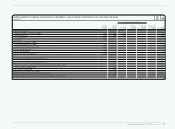
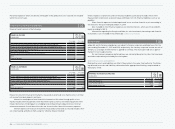
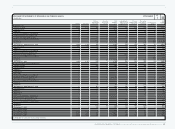
NET SALES (NON-GROUP)
€ IN MILLIONS
Year ending
Dec. 31, 2009 Year ending
Dec. 31, 2008
Footwear 4,642 4,919
Apparel 4,663 4,775
Hardware 1,076 1,105
Total 10,381 10,799
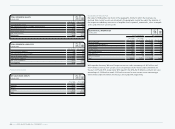
Geographical information Geographical information
Net sales to third parties are shown in the geographic market in which the revenues are
realised. Non-current assets are allocated to the geographic market based on the domicile of
the respective subsidiary and consist of tangible assets, goodwill, trademarks, other intangible
assets and other non-current assets.
N
°-
35
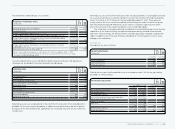
GEOGRAPHICAL INFORMATION
€ IN MILLIONS
Net sales (non-Group) Non-current assets
Year ending
Dec. 31, 2009 Year ending
Dec. 31, 2008 Dec. 31, 2009 Dec. 31, 2008
Western Europe 3,262 3,527 1,505 1,563
European Emerging Markets 1,122 1,179 437 469
North America 2,360 2,520 666 813
Greater China 967 1,077 474 485
Other Asian Markets 1,647 1,585 521 546
Latin America 1,006 893 225 222
HQ/Consolidation 17 18 0 0
Total 10,381 10,799 3,828 4,098
With regard to Germany, Western Europe contains net sales amounting to € 587 million and
€ 601 million as well as non-current assets amounting to € 281 million and € 295 million for
the years 2009 and 2008, respectively. With regard to the USA, North America contains net sales
amounting to € 2,068 million and € 2,209 million as well as non-current assets amounting to
€ 547 million and € 692 million for the years 2009 and 2008, respectively.