Reebok 2009 Annual Report Download - page 125
Download and view the complete annual report
Please find page 125 of the 2009 Reebok annual report below. You can navigate through the pages in the report by either clicking on the pages listed below, or by using the keyword search tool below to find specific information within the annual report.-
 1
1 -
2
-
3
-
4
-
5
-
6
-
7
-
8
-
9
-
10
-
11
-
12
-
13
-
14
-
15
-
16
-
17
-
18
-
19
-
20
-
21
-
22
-
23
-
24
-
25
-
26
-
27
-
28
-
29
-
30
-
31
-
32
-
33
-
34
-
35
-
36
-
37
-
38
-
39
-
40
-
41
-
42
-
43
-
44
-
45
-
46
-
47
-
48
-
49
-
50
-
51
-
52
-
53
-
54
-
55
-
56
-
57
-
58
-
59
-
60
-
61
-
62
-
63
-
64
-
65
-
66
-
67
-
68
-
69
-
70
-
71
-
72
-
73
-
74
-
75
-
76
-
77
-
78
-
79
-
80
-
81
-
82
-
83
-
84
-
85
-
86
-
87
-
88
-
89
-
90
-
91
-
92
-
93
-
94
-
95
-
96
-
97
-
98
-
99
-
100
-
101
-
102
-
103
-
104
-
105
-
106
-
107
-
108
-
109
-
110
-
111
-
112
-
113
-
114
-
 115
115 -
 116
116 -
 117
117 -
 118
118 -
 119
119 -
 120
120 -
 121
121 -
 122
122 -
 123
123 -
 124
124 -
 125
125 -
 126
126 -
 127
127 -
 128
128 -
 129
129 -
 130
130 -
 131
131 -
 132
132 -
 133
133 -
 134
134 -
 135
135 -
136
-
137
-
138
-
139
-
140
-
141
-
142
-
143
-
144
-
145
-
146
-
147
-
148
-
149
-
150
-
151
-
152
-
153
-
154
-
155
-
156
-
157
-
158
-
159
-
160
-
161
-
162
-
163
-
164
-
165
-
166
-
167
-
168
-
169
-
170
-
171
-
172
-
173
-
174
-
175
-
176
-
177
-
178
-
179
-
180
-
181
-
182
-
183
-
184
-
185
-
186
-
187
-
188
-
189
-
190
-
191
-
192
-
193
-
194
-
195
-
196
-
197
-
198
-
199
-
200
-
201
-
202
-
203
-
204
-
205
-
206
-
207
-
208
-
209
-
210
-
211
-
212
-
213
-
214
-
215
-
216
-
217
-
218
-
219
-
220
-
221
-
222
-
223
-
224
-
225
-
226
-
227
-
228
-
229
-
230
-
231
-
232
-
233
-
234
 |
 |
GROUP MANAGEMENT REPORT – FINANCIAL REVIEW GROUP BUSINESS PERFORMANCE Income Statement 121
N
°-
31
N
°-
33
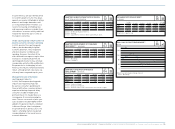
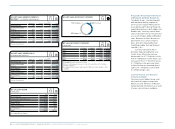
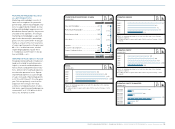
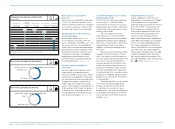
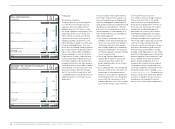
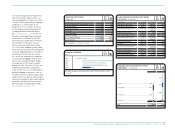
NET INCOME ATTRIBUTABLE TO SHAREHOLDERS
€ IN MILLIONS
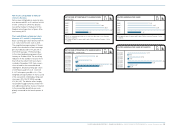
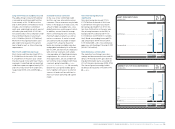
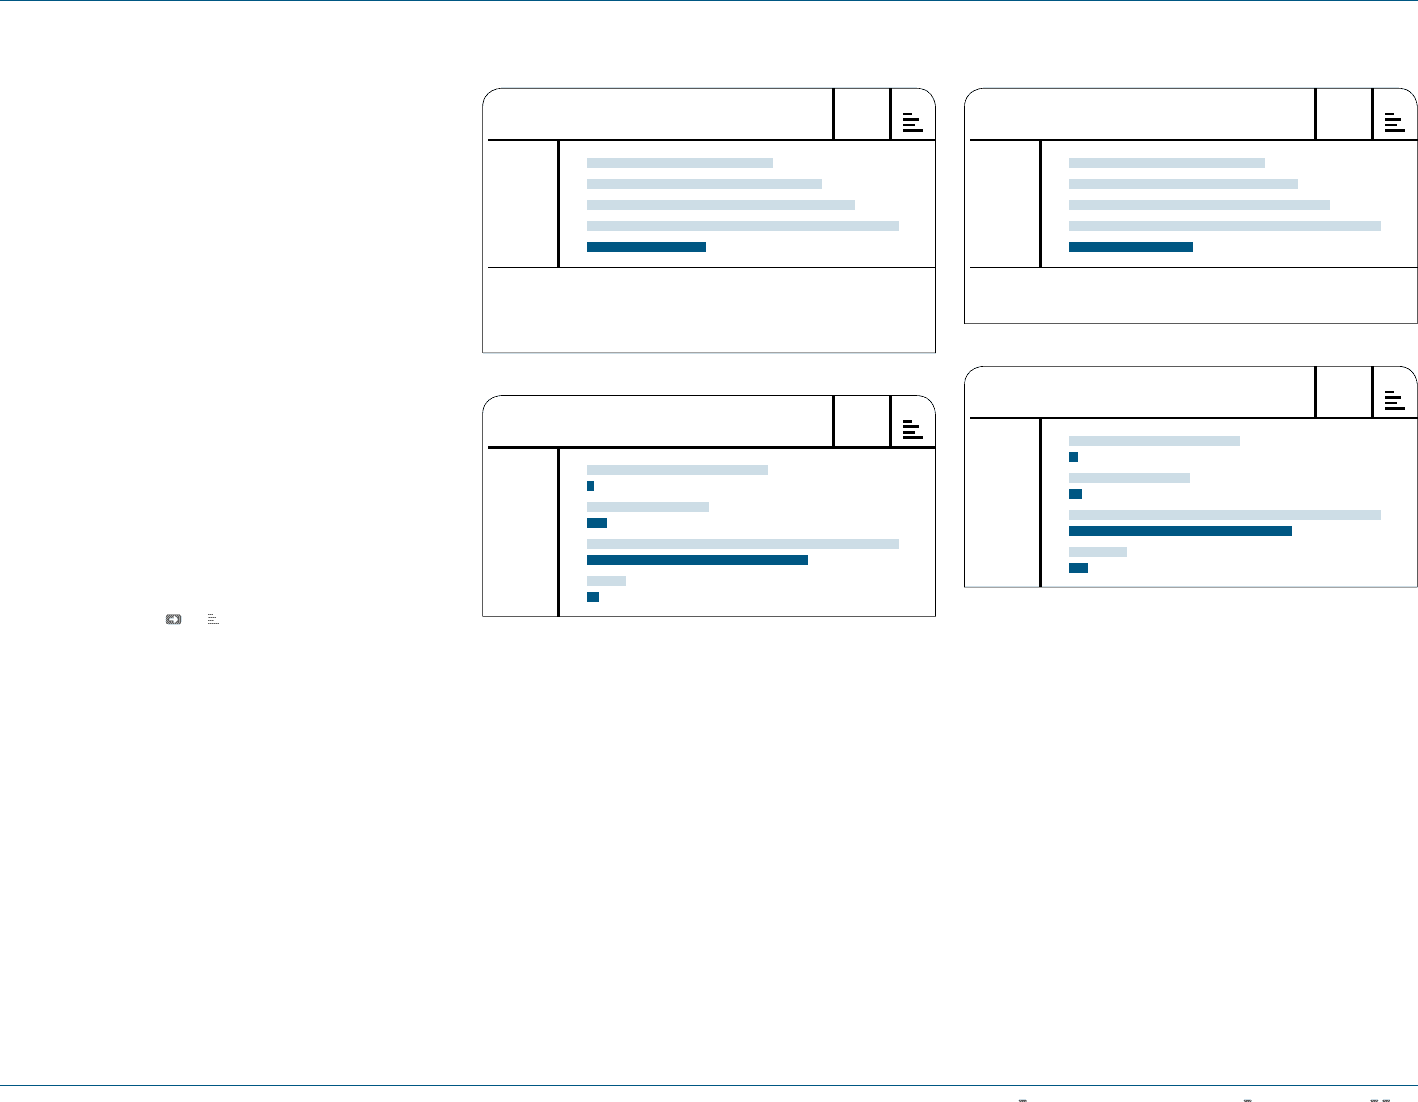
DILUTED EARNINGS PER SHARE
IN €
2005 1 )
2006 2 )
2007
2008
2009
2005
2006 1 )
2007
2008
2009
1.93
2.25
2.57
3.07
1.22
1) Reflects continuing operations as a result of the divestiture of the Salomon
business segment.
2) Including Reebok, Rockport and Reebok-CCM Hockey from February 1, 2006
onwards.
1) Including Reebok, Rockport and Reebok-CCM Hockey from February 1, 2006
onwards.
N
°-
32
N
°-
34
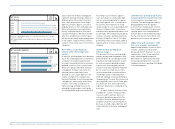
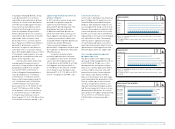
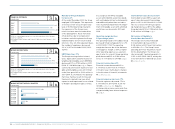
NET INCOME ATTRIBUTABLE TO SHAREHOLDERS
BY QUARTER € IN MILLIONS
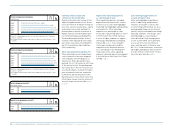
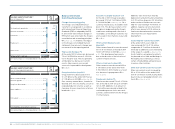
DILUTED EARNINGS PER SHARE BY QUARTER
IN €
Q1 2008
Q1 2009
Q2 2008
Q2 2009
Q3 2008
Q3 2009
Q4 2008
Q4 2009
Q1 2008
Q1 2009
Q2 2008
Q2 2009
Q3 2008
Q3 2009
Q4 2008
Q4 2009
169
5
116
9
302
213
54
19
0.79
0.04
0.56
0.06
1.44
1.03
0.27
0.09
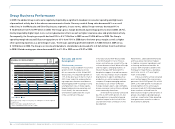
Net income attributable to minority
interests declines
Net income attributable to minority inter-
ests decreased 95% to € 0 million in 2009
from € 2 million in 2008. The decline
was primarily due to the buyout of the
Reebok minority partner in Spain, effec-
tive January 2009.
Basic and diluted earnings per share
decrease 61% and 60%, respectively
Basic earnings per share decreased 61%
to € 1.25 in 2009 from € 3.25 in 2008.
The weighted average number of shares
used in the calculation of basic earnings
per share decreased to 196,220,166 in
2009 (2008 average: 197,562,346) due
to the share buyback programme from
January to October 2008. The resulting
reduction in the number of shares more
than offset the effect from new shares
created in November 2009 from conver-
sions related to the convertible bond
redemption. Diluted earnings per share
in 2009 decreased 60% to € 1.22 from
€ 3.07 in the prior year see 33. The
weighted average number of shares used
in the calculation of diluted earnings per
share was 209,238,099 (2008 average:
213,333,203). The dilutive effect largely
resulted from approximately sixteen mil-
lion additional potential shares in relation
to the convertible bond that was com-
pletely converted in the fourth quarter of
2009.
383
483
551
642
245