Reebok 2009 Annual Report Download - page 136
Download and view the complete annual report
Please find page 136 of the 2009 Reebok annual report below. You can navigate through the pages in the report by either clicking on the pages listed below, or by using the keyword search tool below to find specific information within the annual report.-
 1
1 -
2
-
3
-
4
-
5
-
6
-
7
-
8
-
9
-
10
-
11
-
12
-
13
-
14
-
15
-
16
-
17
-
18
-
19
-
20
-
21
-
22
-
23
-
24
-
25
-
26
-
27
-
28
-
29
-
30
-
31
-
32
-
33
-
34
-
35
-
36
-
37
-
38
-
39
-
40
-
41
-
42
-
43
-
44
-
45
-
46
-
47
-
48
-
49
-
50
-
51
-
52
-
53
-
54
-
55
-
56
-
57
-
58
-
59
-
60
-
61
-
62
-
63
-
64
-
65
-
66
-
67
-
68
-
69
-
70
-
71
-
72
-
73
-
74
-
75
-
76
-
77
-
78
-
79
-
80
-
81
-
82
-
83
-
84
-
85
-
86
-
87
-
88
-
89
-
90
-
91
-
92
-
93
-
94
-
95
-
96
-
97
-
98
-
99
-
100
-
101
-
102
-
103
-
104
-
105
-
106
-
107
-
108
-
109
-
110
-
111
-
112
-
113
-
114
-
115
-
116
-
117
-
118
-
119
-
120
-
121
-
122
-
123
-
124
-
125
-
 126
126 -
 127
127 -
 128
128 -
 129
129 -
 130
130 -
 131
131 -
 132
132 -
 133
133 -
 134
134 -
 135
135 -
 136
136 -
 137
137 -
 138
138 -
 139
139 -
 140
140 -
 141
141 -
 142
142 -
 143
143 -
 144
144 -
 145
145 -
 146
146 -
147
-
148
-
149
-
150
-
151
-
152
-
153
-
154
-
155
-
156
-
157
-
158
-
159
-
160
-
161
-
162
-
163
-
164
-
165
-
166
-
167
-
168
-
169
-
170
-
171
-
172
-
173
-
174
-
175
-
176
-
177
-
178
-
179
-
180
-
181
-
182
-
183
-
184
-
185
-
186
-
187
-
188
-
189
-
190
-
191
-
192
-
193
-
194
-
195
-
196
-
197
-
198
-
199
-
200
-
201
-
202
-
203
-
204
-
205
-
206
-
207
-
208
-
209
-
210
-
211
-
212
-
213
-
214
-
215
-
216
-
217
-
218
-
219
-
220
-
221
-
222
-
223
-
224
-
225
-
226
-
227
-
228
-
229
-
230
-
231
-
232
-
233
-
234
 |
 |
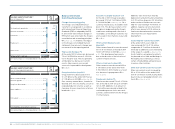
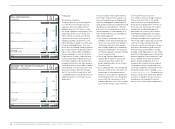
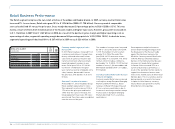
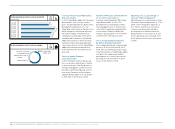
132 GROUP MANAGEMENT REPORT – FINANCIAL REVIEW BUSINESS PERFORMANCE BY SEGMENT Wholesale Business Performance
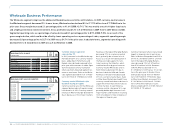
Wholesale Business Performance
The Wholesale segment comprises the adidas and Reebok business activities with retailers. In 2009, currency-neutral sales in
the Wholesale segment decreased 9%. In euro terms, Wholesale sales declined 8% to € 7.174 billion from € 7.758 billion in the
prior year. Gross margin decreased 2.1 percentage points to 41.6% (2008: 43.7%). This was mainly a result of higher input costs
and a highly promotional retail environment. Gross profit decreased 12% to € 2.981 billion in 2009 from € 3.387 billion in 2008.
Segmental operating costs as a percentage of sales decreased 0.1 percentage points to 8.9% (2008: 9.0%). As a result of the
gross margin decline, which could not be offset by lower operating costs as a percentage of sales, segmental operating margin
decreased 2.0 percentage points to 32.7% in 2009 versus 34.7% in the prior year. In absolute terms, segmental operating profit
declined 13% to € 2.346 billion in 2009 versus € 2.692 billion in 2008.
Currency-neutral segmental
sales decline 9%
In 2009, revenues for the Wholesale seg-
ment declined 9% on a currency-neutral
basis. adidas Sport Performance and
Reebok sales declined compared to the
prior year while revenues at adidas Sport
Style increased. Currency translation
effects positively impacted segment rev-
enues in euro terms. Sales in the Whole-
sale segment declined 8% to € 7.174 bil-
lion in 2009 from € 7.758 billion in 2008.
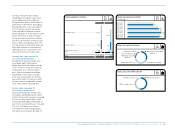
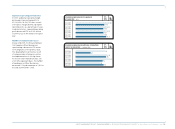
Currency-neutral Wholesale sales
decline in nearly all regions
Currency-neutral sales for the Wholesale
segment decreased in all regions except
Latin America in 2009. Currency-neutral
revenues in Western Europe declined 8%
due to decreases in most major markets.
Revenues in European Emerging Markets
decreased 13% on a currency-neutral
basis, primarily due to lower sales in
Russia as a result of the devaluation of
the Russian rouble against its func-
tional currency, the US dollar, which
could not be offset by price increases.
Currency- neutral Wholesale sales in
North America declined 16% due to
declines in both the USA and Canada.
Revenues in Greater China decreased
20% on a currency- neutral basis. Sales
in Other Asian Markets declined 5% on a
currency- neutral basis due to declines in
Japan which more than offset increases
in other markets. In Latin America,
currency-neutral sales grew 16%, sup-
ported by double-digit increases in all
major markets and the effects resulting
from consolidation of new companies in
the region in the prior year.
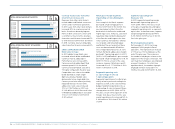
Currency translation effects had a mixed
impact on regional sales in euro terms.
Sales in Western Europe declined 10% in
2009 to € 2.643 billion (2008: € 2.936 bil-
lion). In European Emerging Markets,
sales decreased 13% to € 475 million
from € 543 million in 2008. Revenues
in North America declined 11% to
€ 1.295 billion in 2009 versus € 1.461 bil-
lion in the prior year. In Greater China,
revenues decreased 14% to € 855 mil-
lion in 2009 (2008: € 999 million). Sales
in Other Asian Markets increased 1% to
€ 1.041 billion in 2009 from € 1.029 bil-
lion in 2008, while revenues in Latin
America improved 10% to € 865 million in
2009 (2008: € 790 million).
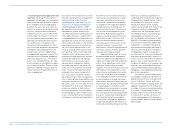
N
°-
01
WHOLESALE AT A GLANCE
€ IN MILLIONS
2009 2008 Change
Net sales 7,174 7,758 (8%)
Gross profit 2,981 3,387 (12%)
Gross margin 41.6% 43.7% (2.1pp)
Segmental operating profit 2,346 2,692 (13%)
Segmental operating margin 32.7% 34.7% (2.0pp)
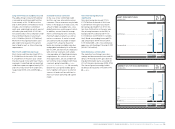
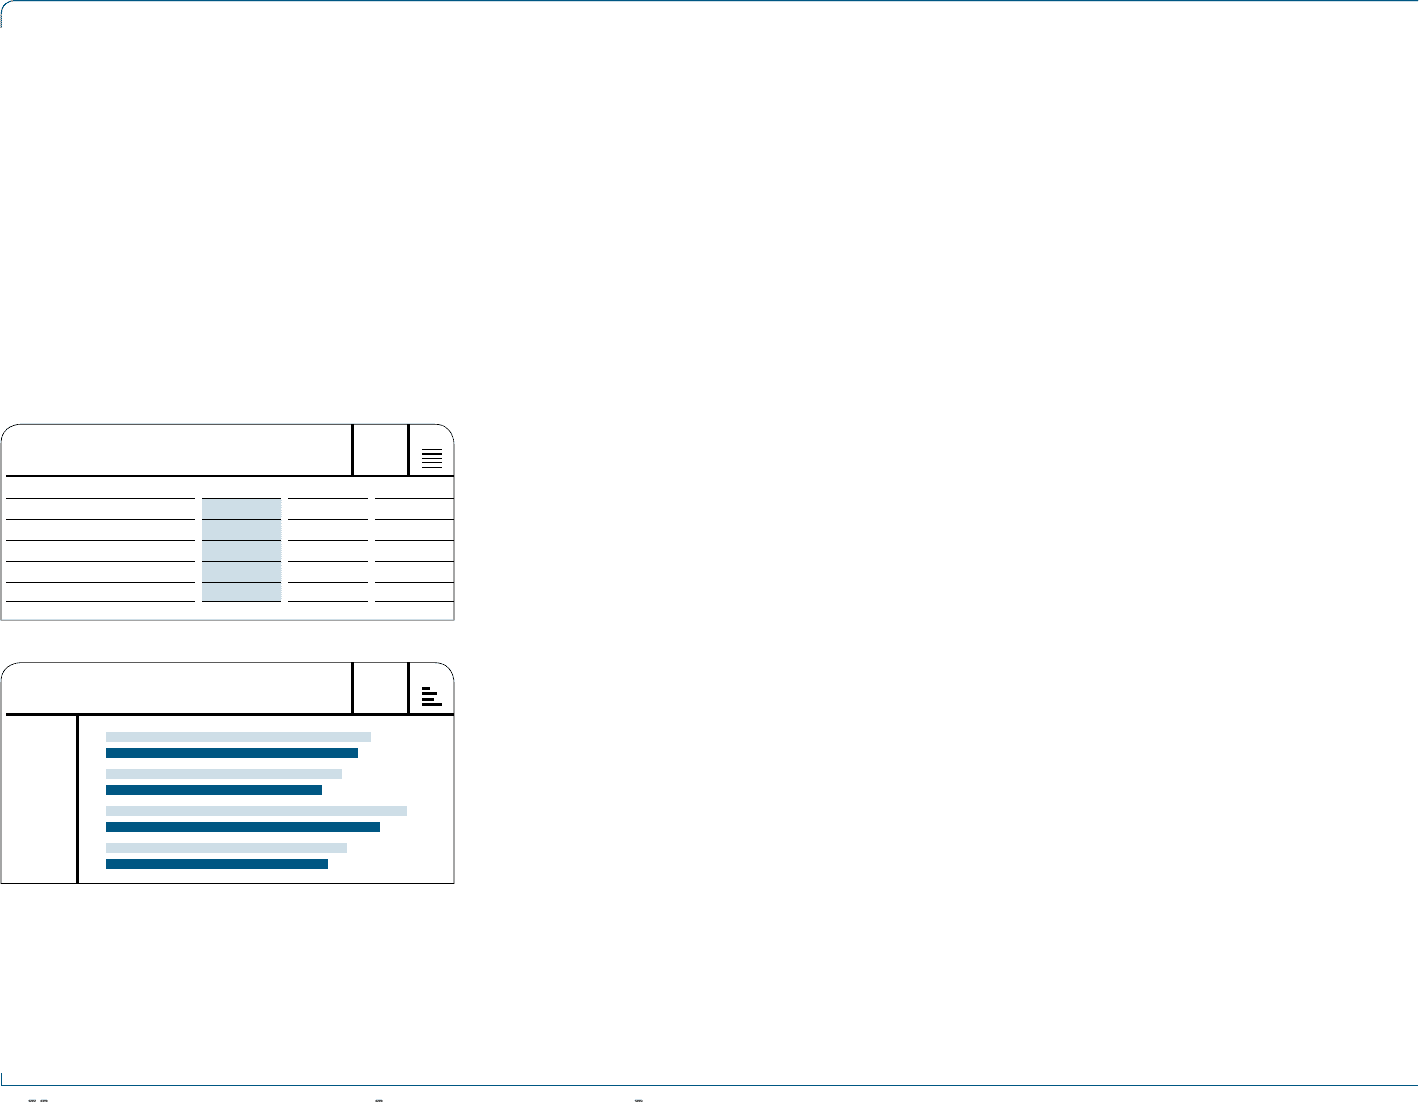
N
°-
02
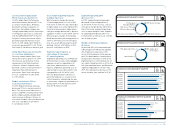
WHOLESALE NET SALES BY QUARTER
€ IN MILLIONS
Q1 2008
Q1 2009
Q2 2008
Q2 2009
Q3 2008
Q3 2009
Q4 2008
Q4 2009
1,968
1,876
1,755
1,608
2,241
2,040
1,794
1,650