Reebok 2009 Annual Report Download - page 47
Download and view the complete annual report
Please find page 47 of the 2009 Reebok annual report below. You can navigate through the pages in the report by either clicking on the pages listed below, or by using the keyword search tool below to find specific information within the annual report.-
 1
1 -
2
-
3
-
4
-
5
-
6
-
7
-
8
-
9
-
10
-
11
-
12
-
13
-
14
-
15
-
16
-
17
-
18
-
19
-
20
-
21
-
22
-
23
-
24
-
25
-
26
-
27
-
28
-
29
-
30
-
31
-
32
-
33
-
34
-
35
-
36
-
 37
37 -
 38
38 -
 39
39 -
 40
40 -
 41
41 -
 42
42 -
 43
43 -
 44
44 -
 45
45 -
 46
46 -
 47
47 -
 48
48 -
 49
49 -
 50
50 -
 51
51 -
 52
52 -
 53
53 -
 54
54 -
 55
55 -
 56
56 -
 57
57 -
58
-
59
-
60
-
61
-
62
-
63
-
64
-
65
-
66
-
67
-
68
-
69
-
70
-
71
-
72
-
73
-
74
-
75
-
76
-
77
-
78
-
79
-
80
-
81
-
82
-
83
-
84
-
85
-
86
-
87
-
88
-
89
-
90
-
91
-
92
-
93
-
94
-
95
-
96
-
97
-
98
-
99
-
100
-
101
-
102
-
103
-
104
-
105
-
106
-
107
-
108
-
109
-
110
-
111
-
112
-
113
-
114
-
115
-
116
-
117
-
118
-
119
-
120
-
121
-
122
-
123
-
124
-
125
-
126
-
127
-
128
-
129
-
130
-
131
-
132
-
133
-
134
-
135
-
136
-
137
-
138
-
139
-
140
-
141
-
142
-
143
-
144
-
145
-
146
-
147
-
148
-
149
-
150
-
151
-
152
-
153
-
154
-
155
-
156
-
157
-
158
-
159
-
160
-
161
-
162
-
163
-
164
-
165
-
166
-
167
-
168
-
169
-
170
-
171
-
172
-
173
-
174
-
175
-
176
-
177
-
178
-
179
-
180
-
181
-
182
-
183
-
184
-
185
-
186
-
187
-
188
-
189
-
190
-
191
-
192
-
193
-
194
-
195
-
196
-
197
-
198
-
199
-
200
-
201
-
202
-
203
-
204
-
205
-
206
-
207
-
208
-
209
-
210
-
211
-
212
-
213
-
214
-
215
-
216
-
217
-
218
-
219
-
220
-
221
-
222
-
223
-
224
-
225
-
226
-
227
-
228
-
229
-
230
-
231
-
232
-
233
-
234
 |
 |
TO OUR SHAREHOLDERS Our Share 43
N
°-
02
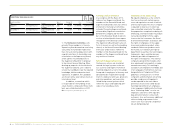
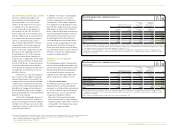
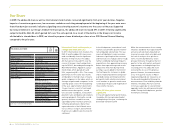
ADIDAS AG MARKET CAPITALISATION
AT YEAR-END € IN MILLIONS
2005
2006
2007
2008
2009
8,122
7,679
10,438
5,252
7,902
N
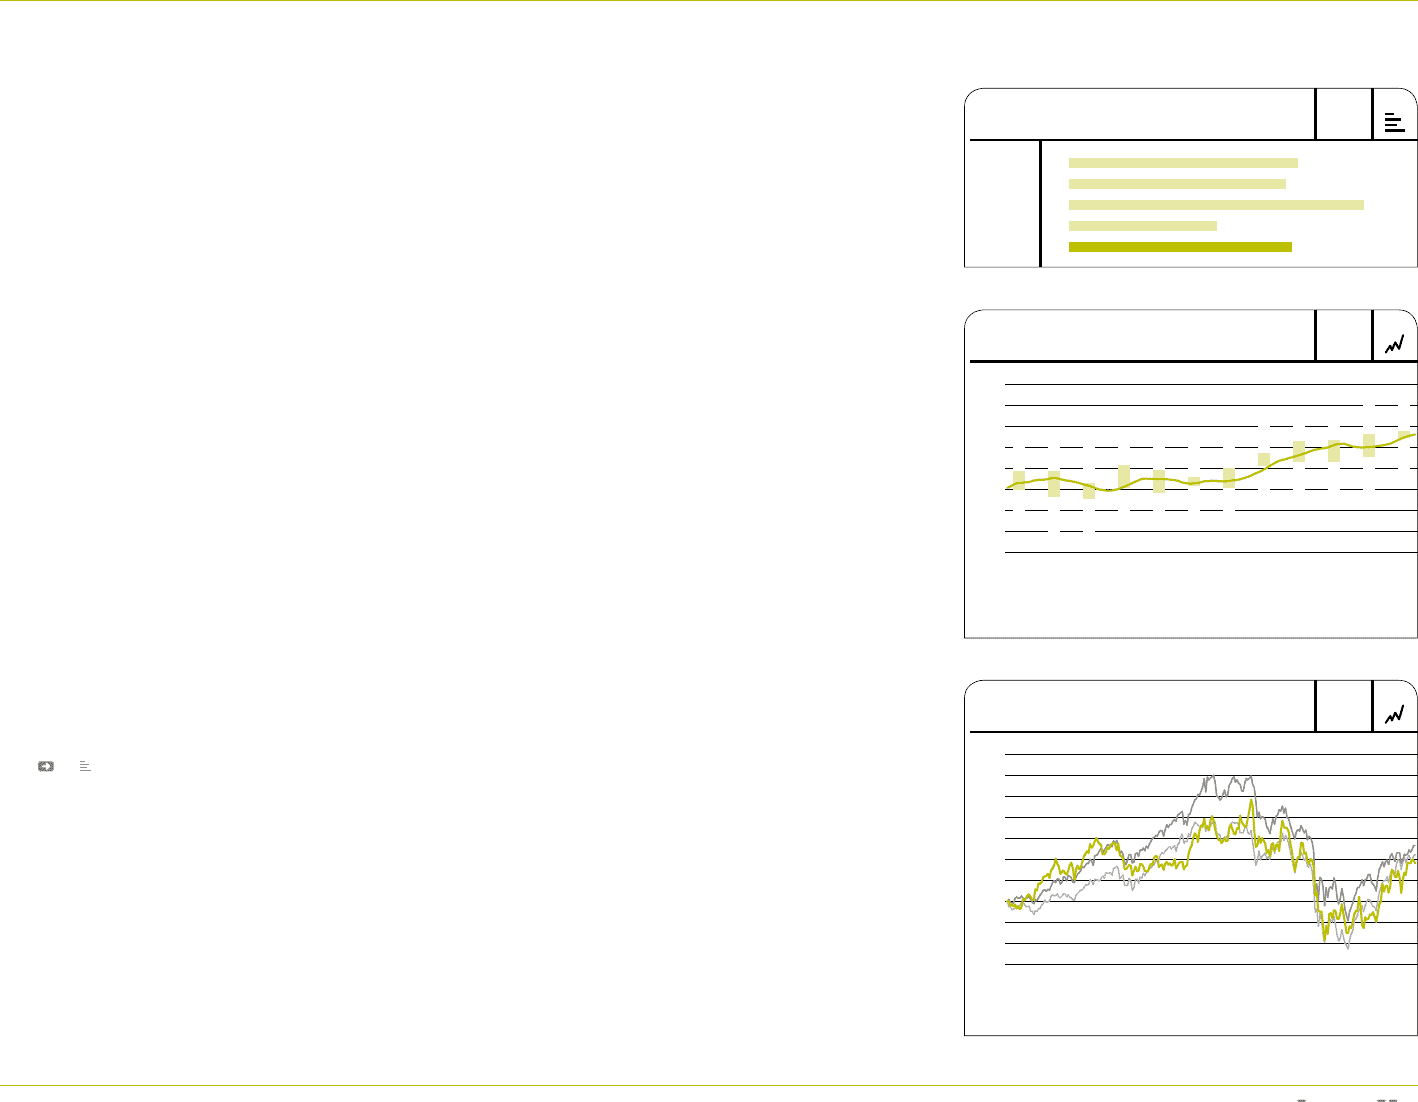
°-
03
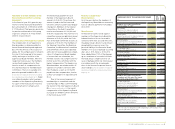
ADIDAS AG HIGH AND LOW SHARE PRICES
PER MONTH 1)
Jan. 2009 Dec. 2009
40
30
20
—
30-day moving average
|
High and low share prices
1) Based on daily closing prices.
Source: Bloomberg.
The adidas Group first half year results,
announced on August 5, were well
received by investors and further sup-
ported the upward development. Several
analysts’ upgrades and favourable com-
ments regarding the Group’s efforts to
reduce inventories and net borrowings
helped the adidas AG share outperform
the market.
In the fourth quarter, after the
announcement of the early redemption
of our € 400 million convertible bond on
October 7, all bondholders converted into
ordinary shares. However, the resulting
issuance of 15.7 million additional ordi-
nary shares had only a limited negative
impact on our share price development.
Instead, analysts acknowledged the early
achievement of the Group’s medium-
term financial leverage target and better
than expected third quarter results pub-
lished at the beginning of November. As a
result, our share price performed better
than the market through to year-end, as
several analysts expressed their confi-
dence in the Group’s medium-term strat-
egy. Accordingly, the adidas AG share
closed 2009 at € 37.77, having gained
39% over the course of the year. Due to
this development, our market capitalisa-
tion increased to € 7.9 billion at the end
of 2009 versus € 5.3 billion at the end of
2008 see 02.
adidas AG share member of adidas AG share member of
important indicesimportant indices
The adidas AG share is included in a
variety of high-quality indices around
the world, most importantly the DAX-30
and the MSCI World Textiles, Apparel &
Luxury Goods Index.
The DAX-30 is a blue chip stock market
index consisting of the 30 major German
companies trading on the Frankfurt Stock
Exchange.
The MSCI World Textiles, Apparel
& Luxury Goods Index comprises our
Group’s major competitors. At December
31, 2009, our weighting in the DAX-30,
which is calculated on the basis of free
float market capitalisation and 12-month
share turnover, was 1.49% (2008: 1.19%).
Our increased weighting compared to
the prior year was mainly a result of our
higher market capitalisation, as well as a
more moderate decline in share turnover
compared to the rest of the market. Aver-
age daily trading volume of the adidas AG
share (excluding bank trades) declined
from 2.0 million in 2008 to 1.4 million
shares in 2009. Within the DAX-30, we
ranked 17 on market capitalisation (2008:
19) and 22 on turnover (2008: 25) at year-
end 2009.
Strong sustainability track record Strong sustainability track record
reflected in index membershipsreflected in index memberships
In recognition of our social and envi-
ronmental efforts, adidas AG is listed
in several sustainability indices. For the
tenth consecutive time, adidas AG has
been included in the Dow Jones Sustain-
ability Indexes (DJSI). The indexes, which
analyse and track the social, environ-
mental and financial performance of
more than 300 companies worldwide,
rated adidas AG for the seventh time in
a row as industry leader in sustainability
issues and corporate responsibility in the
category “Clothing, Accessories & Foot-
wear”. In addition, adidas AG was named
“Super Sector Leader” 2009/2010 in the
sector “Personal & Household Goods”
for the second consecutive time and thus
ranks among the most sustainable com-
panies worldwide.
In addition, adidas AG was again included
in the FTSE4Good Europe Index. This
positive reassessment acknowledges
the Group’s social, environmental and
ethical engagement, and encourages
us to continue and intensify our efforts
to improve our sustainability perform-
ance. Also, adidas AG was again included
in the Vigeo Group’s Ethibel Excellence
Sustainability Index Europe as well as
in the ASPI Eurozone Index. The Vigeo
Group is a leading European supplier of
extra-financial analysis that measures
companies’ performance in the fields
of sustainable development and social
responsibility. Further, the adidas Group
was included for the fifth consecutive
time in the list of The Global 100 Most
Sustainable Corporations in the World.
This is a project initiated by Corporate
Knights Inc. with Innovest Strategic Value
Advisors Inc., a research firm specialised
in analysing extra-financial drivers of risk
and shareholder value. Launched in 2005,
the annual list of The Global 100 Most
Sustainable Corporations in the World is
unveiled each year at the World Economic
Forum in Davos.
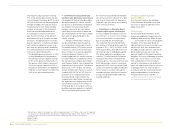
N
°-
04
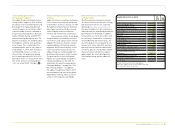
FIVE-YEAR SHARE PRICE DEVELOPMENT 1 )
Dec. 31, 2004 Dec. 31, 2009
190
160
130
100
70
—
adidas AG
—
DAX-30
—
MSCI World Textiles, Apparel & Luxury Goods Index
1) Index: December 31, 2004 = 100.
29.20
29.19
26.47
30.61
29.50
27.88
30.08
33.63
36.50
36.60
38.13
38.76
24.94
23.01
22.73
25.14
23.99
25.71
25.28
30.42
31.48
31.50
32.64
37.19