Reebok 2009 Annual Report Download - page 202
Download and view the complete annual report
Please find page 202 of the 2009 Reebok annual report below. You can navigate through the pages in the report by either clicking on the pages listed below, or by using the keyword search tool below to find specific information within the annual report.-
 1
1 -
2
-
3
-
4
-
5
-
6
-
7
-
8
-
9
-
10
-
11
-
12
-
13
-
14
-
15
-
16
-
17
-
18
-
19
-
20
-
21
-
22
-
23
-
24
-
25
-
26
-
27
-
28
-
29
-
30
-
31
-
32
-
33
-
34
-
35
-
36
-
37
-
38
-
39
-
40
-
41
-
42
-
43
-
44
-
45
-
46
-
47
-
48
-
49
-
50
-
51
-
52
-
53
-
54
-
55
-
56
-
57
-
58
-
59
-
60
-
61
-
62
-
63
-
64
-
65
-
66
-
67
-
68
-
69
-
70
-
71
-
72
-
73
-
74
-
75
-
76
-
77
-
78
-
79
-
80
-
81
-
82
-
83
-
84
-
85
-
86
-
87
-
88
-
89
-
90
-
91
-
92
-
93
-
94
-
95
-
96
-
97
-
98
-
99
-
100
-
101
-
102
-
103
-
104
-
105
-
106
-
107
-
108
-
109
-
110
-
111
-
112
-
113
-
114
-
115
-
116
-
117
-
118
-
119
-
120
-
121
-
122
-
123
-
124
-
125
-
126
-
127
-
128
-
129
-
130
-
131
-
132
-
133
-
134
-
135
-
136
-
137
-
138
-
139
-
140
-
141
-
142
-
143
-
144
-
145
-
146
-
147
-
148
-
149
-
150
-
151
-
152
-
153
-
154
-
155
-
156
-
157
-
158
-
159
-
160
-
161
-
162
-
163
-
164
-
165
-
166
-
167
-
168
-
169
-
170
-
171
-
172
-
173
-
174
-
175
-
176
-
177
-
178
-
179
-
180
-
181
-
182
-
183
-
184
-
185
-
186
-
187
-
188
-
189
-
190
-
191
-
 192
192 -
 193
193 -
 194
194 -
 195
195 -
 196
196 -
 197
197 -
 198
198 -
 199
199 -
 200
200 -
 201
201 -
 202
202 -
 203
203 -
 204
204 -
 205
205 -
 206
206 -
 207
207 -
 208
208 -
 209
209 -
 210
210 -
 211
211 -
 212
212 -
213
-
214
-
215
-
216
-
217
-
218
-
219
-
220
-
221
-
222
-
223
-
224
-
225
-
226
-
227
-
228
-
229
-
230
-
231
-
232
-
233
-
234
 |
 |

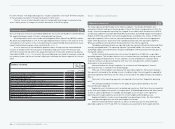
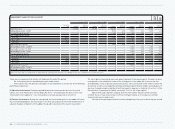
198 CONSOLIDATED FINANCIAL STATEMENTS Notes
N
°-
28
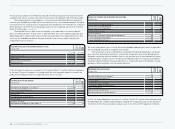
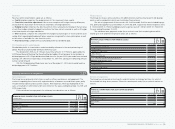
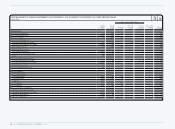
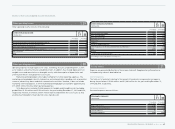
FAIR VALUE HIERARCHY OF FINANCIAL INSTRUMENTS ACCORDING TO IFRS 7
AS AT DECEMBER 31, 2009 € IN MILLIONS
Fair value hierarchy, aggregated by category Fair value
Dec. 31, 2009 Level 1 Level 2 Level 3
Financial assets at fair value through profit or loss
thereof: designated as such upon initial recognition
(Fair Value Option – FVO) —
thereof: Held for Trading
(Financial Assets Held for Trading – FAHfT) 193 114 79 1 )
Available-for-Sale Financial Assets (AfS) 12 12
Other financial assets
Derivatives being part of a hedge 28 28
Financial assets 233 154 79
Financial Liabilities at fair value through profit or loss
Held for Trading (FLHfT) 21 21
Other financial liabilities
Derivatives being part of a hedge 85 85
Financial liabilities 106 106
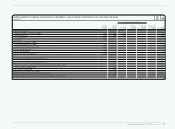
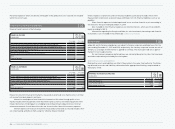
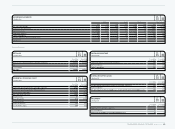
Fair value
Jan. 1, 2009 gains losses Fair value
Dec. 31, 2009
1) This category relates to a 10% investment in
FC Bayern München AG of € 79 million. Dividends
are distributed by FC Bayern München AG instead
of regular interest payments. 77 2 — 79
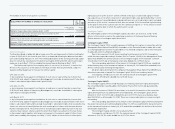
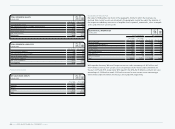
Level 1 is based on quoted prices in active markets for identical assets or liabilities.
Level 2 is based on inputs other than quoted prices included within Level 1 that are observable for the asset or liability, either
directly (i.e. as prices) or indirectly (i.e. derived from prices).
Level 3 is based on inputs for the asset or liability that are not based on observable market data (unobservable inputs).
Due to the short-term maturities of cash and cash equivalents, short-term financial assets,
accounts receivable and payable as well as other current receivables and payables, their respec-
tive fair values approximate their carrying amount.
The fair values of non-current financial assets and liabilities are estimated by discounting
expected future cash flows using current interest rates for debt of similar terms and remaining
maturities, and adjusted by an adidas Group specific credit risk premium.
Fair values of long-term financial assets classified as available-for-sale are based on quoted
market prices in an active market or are calculated as present values of expected future cash
flows.
The fair values of forward contracts and currency options are determined on the basis of
market conditions at the balance sheet date. The fair value of a currency option is determined
using generally accepted models to calculate option prices, such as the “Garman-Kohlhagen-
model”. The fair market value of an option is influenced not only by the remaining term of the
option, but also by other determining factors such as the actual foreign exchange rate and the
volatility of the underlying foreign currency base.
N
°-
28
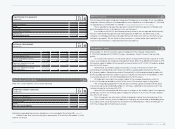
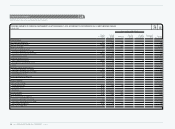
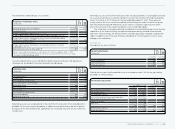
NET GAINS OR (LOSSES) OF FINANCIAL INSTRUMENTS RECOGNISED IN THE
CONSOLIDATED INCOME STATEMENT € IN MILLIONS
Year ending
Dec. 31, 2009 Year ending
Dec. 31, 2008
Financial assets or financial liabilities at fair value through profit or loss 4 (6)
thereof: designated as such upon initial recognition — —
thereof: classified as held for trading 4 (6)
Loans and receivables (44) (27)
Available-for-sale financial assets — —
Financial liabilities measured at amortised cost 5 11