Reebok 2009 Annual Report Download - page 178
Download and view the complete annual report
Please find page 178 of the 2009 Reebok annual report below. You can navigate through the pages in the report by either clicking on the pages listed below, or by using the keyword search tool below to find specific information within the annual report.-
 1
1 -
2
-
3
-
4
-
5
-
6
-
7
-
8
-
9
-
10
-
11
-
12
-
13
-
14
-
15
-
16
-
17
-
18
-
19
-
20
-
21
-
22
-
23
-
24
-
25
-
26
-
27
-
28
-
29
-
30
-
31
-
32
-
33
-
34
-
35
-
36
-
37
-
38
-
39
-
40
-
41
-
42
-
43
-
44
-
45
-
46
-
47
-
48
-
49
-
50
-
51
-
52
-
53
-
54
-
55
-
56
-
57
-
58
-
59
-
60
-
61
-
62
-
63
-
64
-
65
-
66
-
67
-
68
-
69
-
70
-
71
-
72
-
73
-
74
-
75
-
76
-
77
-
78
-
79
-
80
-
81
-
82
-
83
-
84
-
85
-
86
-
87
-
88
-
89
-
90
-
91
-
92
-
93
-
94
-
95
-
96
-
97
-
98
-
99
-
100
-
101
-
102
-
103
-
104
-
105
-
106
-
107
-
108
-
109
-
110
-
111
-
112
-
113
-
114
-
115
-
116
-
117
-
118
-
119
-
120
-
121
-
122
-
123
-
124
-
125
-
126
-
127
-
128
-
129
-
130
-
131
-
132
-
133
-
134
-
135
-
136
-
137
-
138
-
139
-
140
-
141
-
142
-
143
-
144
-
145
-
146
-
147
-
148
-
149
-
150
-
151
-
152
-
153
-
154
-
155
-
156
-
157
-
158
-
159
-
160
-
161
-
162
-
163
-
164
-
165
-
166
-
167
-
 168
168 -
 169
169 -
 170
170 -
 171
171 -
 172
172 -
 173
173 -
 174
174 -
 175
175 -
 176
176 -
 177
177 -
 178
178 -
 179
179 -
 180
180 -
 181
181 -
 182
182 -
 183
183 -
 184
184 -
 185
185 -
 186
186 -
 187
187 -
 188
188 -
189
-
190
-
191
-
192
-
193
-
194
-
195
-
196
-
197
-
198
-
199
-
200
-
201
-
202
-
203
-
204
-
205
-
206
-
207
-
208
-
209
-
210
-
211
-
212
-
213
-
214
-
215
-
216
-
217
-
218
-
219
-
220
-
221
-
222
-
223
-
224
-
225
-
226
-
227
-
228
-
229
-
230
-
231
-
232
-
233
-
234
 |
 |
174 CONSOLIDATED FINANCIAL STATEMENTS Notes
The recoverable amount is determined on the basis of fair value less costs to sell, which are calcu-
lated with 1% of the fair value. The fair value is determined in discounting the royalty savings after
tax and adding a tax amortisation benefit, resulting from the amortisation of the acquired asset
(“relief-from-royalty method”). These calculations use projections of net sales related royalty
savings, based on financial planning which covers a period of five years in total. Royalty savings
beyond this period are extrapolated using steady growth rates of 1.7% (2008: 1.7%). The growth
rates do not exceed the long-term average growth rate of the business to which the trademarks
are allocated.
The discount rate is based on a weighted average cost of capital calculation considering a
five-year average debt/equity structure and financing costs including the Group’s major competi-
tors. The discount rate used is an after-tax rate and reflects the specific equity and country risk.
The applied discount rate is 9.3% (2008: 8.3%).
If expenditures for internally generated intangible assets qualify for recognition, these are
not expensed as incurred.
Goodwill Goodwill
Goodwill is the excess of the purchase cost over the fair value of acquired identifiable assets and
liabilities. Goodwill arising from the acquisition of a foreign entity and any fair value adjustments
to the carrying amounts of assets and liabilities of that foreign entity are treated as assets and
liabilities of the reporting entity respectively, and are translated at exchange rates prevailing at
the date of the initial consolidation. Goodwill is carried in the functional currency of the acquired
foreign entity.
Acquired goodwill is valued at cost less accumulated impairment losses. Effective January 1,
2005, scheduled amortisation of goodwill ceased due to changes in IFRS. Goodwill is tested annu-
ally for impairment, and additionally when there are indications of potential impairment.
As a consequence of the Group’s reorganisation in the second half of 2009, the goodwill for-
merly allocated to the two cash-generating units adidas and Reebok has been reallocated to new
cash-generating units. This reallocation was based on a relative value approach.
In addition to the already existing and unchanged cash-generating unit TaylorMade-adidas
Golf, the carrying amounts of acquired goodwill are allocated to the following cash-generating
units: Rockport, Reebok-CCM Hockey as well as the 17 regional markets which are responsible for
the joint distribution of adidas and Reebok.
The cash-generating units (or groups of units) represent the lowest level within the Group at
which goodwill is monitored for internal management purposes after the Group’s reorganisation.
The impairment test for goodwill has been performed based on the original cash-generating
units adidas and Reebok, as well as on the newly allocated cash-generating units (or groups of
units).
In both cases, no impairment of goodwill resulted.
The recoverable amount of a cash-generating unit is determined on the basis of value in use.
This calculation uses cash flow projections based on the financial planning covering a five-year
period in total. The planning reflects an expected low- to mid-single-digit sales increase for the
majority of the cash-generating units (or groups of units). We expect slightly higher sales growth
in several of the emerging markets. Furthermore, we expect the operating margin to improve
primarily driven by an improvement in the gross margin as well as lower operating expenses
as a percentage of sales. The planning for capital expenditure and working capital is primarily
based on past experience. The planning for future tax payments is based on current statutory
corporate tax rates of the single cash-generating units (or groups of units). Cash flows beyond this
period are extrapolated using steady growth rates averaging 1.7% (2008: 1.7%). According to our
expectations, these growth rates do not exceed the long-term average growth rate of the business
in which each cash-generating unit operates.
Discount rates are based on a weighted average cost of capital calculation considering a five-
year average debt/equity structure and financing costs including the Group’s major competitors
for each cash-generating unit (or group of units). The discount rates used are after-tax rates and
reflect the specific equity and country risk of the relevant cash-generating unit.
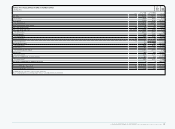
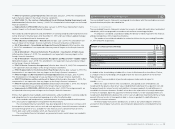
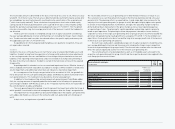
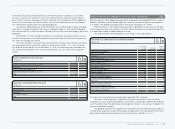
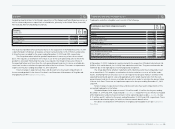
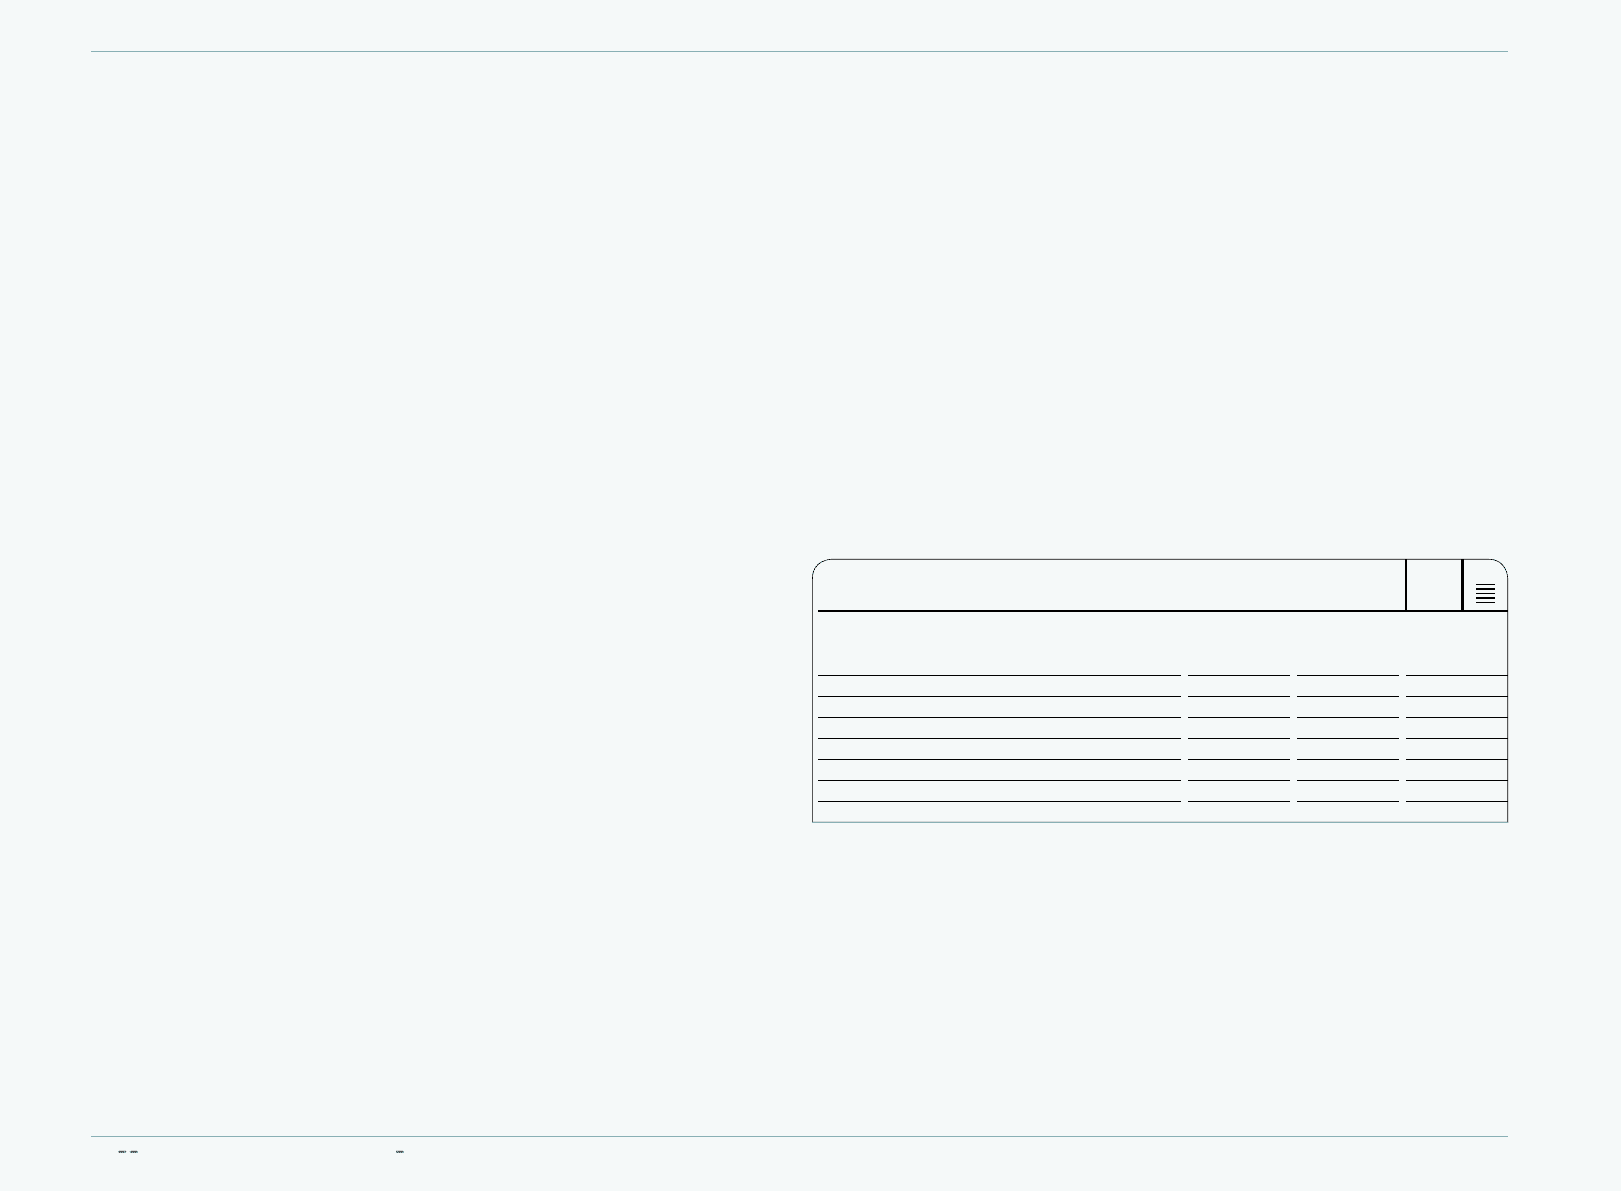
The carrying amounts of acquired goodwill as well as of intangible assets allocated to the
respective cash-generating unit (or group of units) and the respective discount rates applied to the
cash flow projections are as follows:
N
°-
02
ALLOCATION OF GOODWILL
€ IN MILLIONS
Goodwill
(€ in millions)
Intangible assets
with indefinite
useful lives
(€ in millions) Discount rate
TaylorMade-adidas Golf 283 25 8.9%
Greater China 210 213 10.2%
Other Asian Markets 159 164 9.9 – 13.9%
Western Europe 513 404 8.2 – 10.5%
Other 313 536
Total 1,478 1,342