Reebok 2009 Annual Report Download - page 123
Download and view the complete annual report
Please find page 123 of the 2009 Reebok annual report below. You can navigate through the pages in the report by either clicking on the pages listed below, or by using the keyword search tool below to find specific information within the annual report.-
 1
1 -
2
-
3
-
4
-
5
-
6
-
7
-
8
-
9
-
10
-
11
-
12
-
13
-
14
-
15
-
16
-
17
-
18
-
19
-
20
-
21
-
22
-
23
-
24
-
25
-
26
-
27
-
28
-
29
-
30
-
31
-
32
-
33
-
34
-
35
-
36
-
37
-
38
-
39
-
40
-
41
-
42
-
43
-
44
-
45
-
46
-
47
-
48
-
49
-
50
-
51
-
52
-
53
-
54
-
55
-
56
-
57
-
58
-
59
-
60
-
61
-
62
-
63
-
64
-
65
-
66
-
67
-
68
-
69
-
70
-
71
-
72
-
73
-
74
-
75
-
76
-
77
-
78
-
79
-
80
-
81
-
82
-
83
-
84
-
85
-
86
-
87
-
88
-
89
-
90
-
91
-
92
-
93
-
94
-
95
-
96
-
97
-
98
-
99
-
100
-
101
-
102
-
103
-
104
-
105
-
106
-
107
-
108
-
109
-
110
-
111
-
112
-
 113
113 -
 114
114 -
 115
115 -
 116
116 -
 117
117 -
 118
118 -
 119
119 -
 120
120 -
 121
121 -
 122
122 -
 123
123 -
 124
124 -
 125
125 -
 126
126 -
 127
127 -
 128
128 -
 129
129 -
 130
130 -
 131
131 -
 132
132 -
 133
133 -
134
-
135
-
136
-
137
-
138
-
139
-
140
-
141
-
142
-
143
-
144
-
145
-
146
-
147
-
148
-
149
-
150
-
151
-
152
-
153
-
154
-
155
-
156
-
157
-
158
-
159
-
160
-
161
-
162
-
163
-
164
-
165
-
166
-
167
-
168
-
169
-
170
-
171
-
172
-
173
-
174
-
175
-
176
-
177
-
178
-
179
-
180
-
181
-
182
-
183
-
184
-
185
-
186
-
187
-
188
-
189
-
190
-
191
-
192
-
193
-
194
-
195
-
196
-
197
-
198
-
199
-
200
-
201
-
202
-
203
-
204
-
205
-
206
-
207
-
208
-
209
-
210
-
211
-
212
-
213
-
214
-
215
-
216
-
217
-
218
-
219
-
220
-
221
-
222
-
223
-
224
-
225
-
226
-
227
-
228
-
229
-
230
-
231
-
232
-
233
-
234
 |
 |
GROUP MANAGEMENT REPORT – FINANCIAL REVIEW GROUP BUSINESS PERFORMANCE Income Statement 119
N
°-
24
N
°-
26
N
°-
25
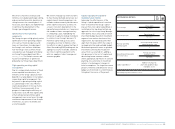
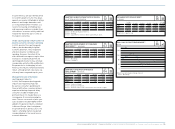
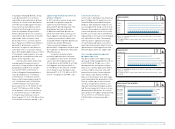
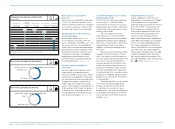
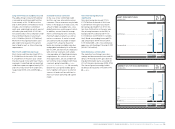
EBITDA
€ IN MILLIONS
OPERATING PROFIT
€ IN MILLIONS
OPERATING MARGIN
IN %
2005 1 )
2006 2 )
2007
2008
2009
2005 1 )
2006 2 )
2007
2008
2009
2005 1 )
2006 2 )
2007
2008
2009
806
1,078
1,165
1,280
780
707
881
949
1,070
508
10.7
8.7
9.2
9.9
4.9
1) Reflects continuing operations as a result of the divestiture of the Salomon
business segment.
2) Including Reebok, Rockport and Reebok-CCM Hockey from February 1, 2006
onwards.
1) Reflects continuing operations as a result of the divestiture of the Salomon
business segment.
2) Including Reebok, Rockport and Reebok-CCM Hockey from February 1, 2006
onwards.
1) Reflects continuing operations as a result of the divestiture of the Salomon
business segment.
2) Including Reebok, Rockport and Reebok-CCM Hockey from February 1, 2006
onwards.
N
°-
23
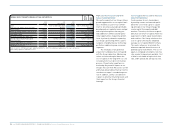
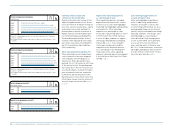
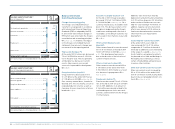
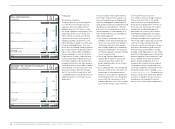
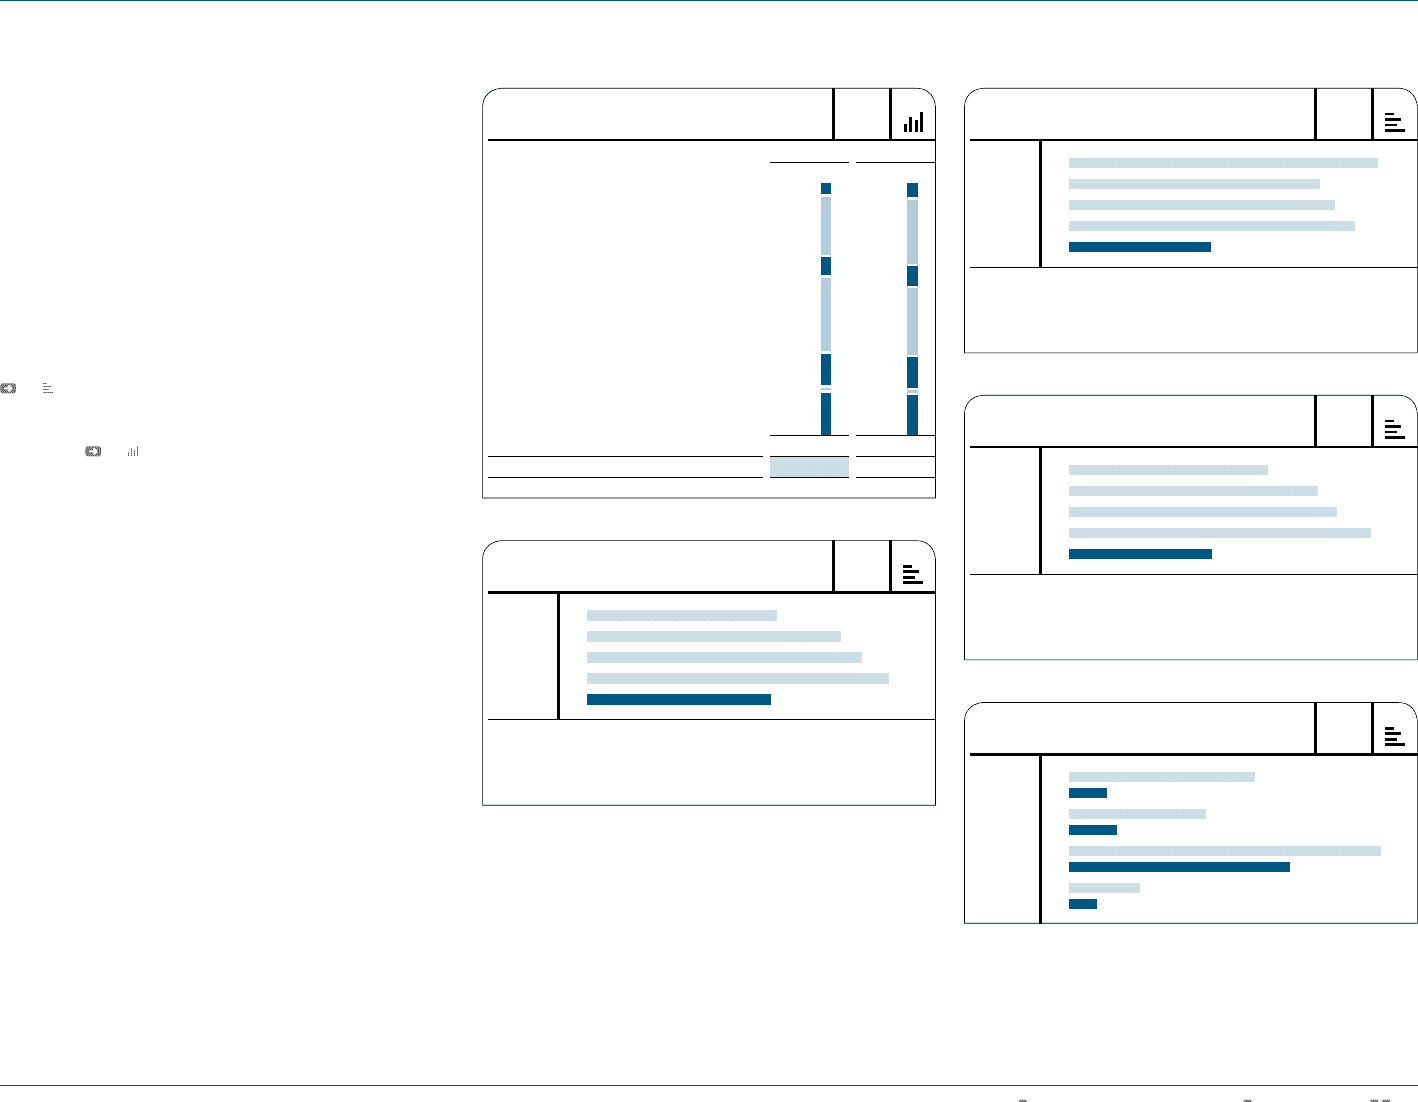
OTHER OPERATING EXPENSES BY AREA
€ IN MILLIONS
2009 2008
Total 4,390 4,378
Sales force ..........................................................1,296
Marketing overhead ..............................................348
Marketing working budget .................................1,028
Sales working budget ...........................................241
565
376
1,132
297
1,179
81
748
Logistics ................................................................582
Finance & administration .....................................809
Research & development ........................................86
N
°-
27
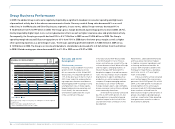
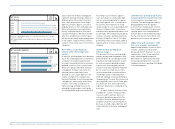
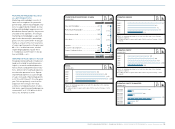
OPERATING PROFIT BY QUARTER
€ IN MILLIONS
Q1 2008
Q1 2009
Q2 2008
Q2 2009
Q3 2008
Q3 2009
Q4 2008
Q4 2009
282
58
208
72
473
336
107
42
Marketing working budget decreases
as a percentage of sales
Marketing working budget consists of
items such as expenses for promotion
partnerships, advertising and public rela-
tions to support brand strength. As mar-
keting working budget expenses are not
distribution channel specific, they are not
allocated to the segments. The Group’s
marketing working budget as a percent-
age of sales decreased 0.6 percentage
points to 9.9% in 2009 (2008: 10.5%), pri-
marily as a result of the non-recurrence
of major sporting events in the prior year
see 22. In absolute terms, market-
ing working budget decreased 9% to
€ 1.028 billion in 2009 from € 1.132 bil-
lion in 2008 see 23.
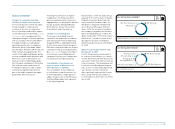
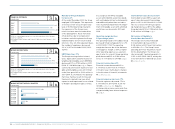
Operating overhead expenses increase
Group operating overheads include over-
head costs related to marketing, sales,
logistics, research and development as
well as finance and administration func-
tions. Almost half of overhead expenses
are related to personnel costs. Operat-
ing overhead expenses as a percentage
of sales increased 2.8 percentage points
to 30.1% in 2009 from 27.3% in the prior
year. This was primarily a result of the
expansion of the Group’s own-retail
activities in emerging markets. In abso-
lute terms, operating overhead expenses
increased 6% to € 3.121 billion in 2009
versus € 2.949 billion in 2008.