Reebok 2009 Annual Report Download - page 128
Download and view the complete annual report
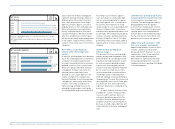
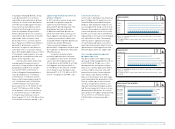
Please find page 128 of the 2009 Reebok annual report below. You can navigate through the pages in the report by either clicking on the pages listed below, or by using the keyword search tool below to find specific information within the annual report.-
 1
1 -
2
-
3
-
4
-
5
-
6
-
7
-
8
-
9
-
10
-
11
-
12
-
13
-
14
-
15
-
16
-
17
-
18
-
19
-
20
-
21
-
22
-
23
-
24
-
25
-
26
-
27
-
28
-
29
-
30
-
31
-
32
-
33
-
34
-
35
-
36
-
37
-
38
-
39
-
40
-
41
-
42
-
43
-
44
-
45
-
46
-
47
-
48
-
49
-
50
-
51
-
52
-
53
-
54
-
55
-
56
-
57
-
58
-
59
-
60
-
61
-
62
-
63
-
64
-
65
-
66
-
67
-
68
-
69
-
70
-
71
-
72
-
73
-
74
-
75
-
76
-
77
-
78
-
79
-
80
-
81
-
82
-
83
-
84
-
85
-
86
-
87
-
88
-
89
-
90
-
91
-
92
-
93
-
94
-
95
-
96
-
97
-
98
-
99
-
100
-
101
-
102
-
103
-
104
-
105
-
106
-
107
-
108
-
109
-
110
-
111
-
112
-
113
-
114
-
115
-
116
-
117
-
 118
118 -
 119
119 -
 120
120 -
 121
121 -
 122
122 -
 123
123 -
 124
124 -
 125
125 -
 126
126 -
 127
127 -
 128
128 -
 129
129 -
 130
130 -
 131
131 -
 132
132 -
 133
133 -
 134
134 -
 135
135 -
 136
136 -
 137
137 -
 138
138 -
139
-
140
-
141
-
142
-
143
-
144
-
145
-
146
-
147
-
148
-
149
-
150
-
151
-
152
-
153
-
154
-
155
-
156
-
157
-
158
-
159
-
160
-
161
-
162
-
163
-
164
-
165
-
166
-
167
-
168
-
169
-
170
-
171
-
172
-
173
-
174
-
175
-
176
-
177
-
178
-
179
-
180
-
181
-
182
-
183
-
184
-
185
-
186
-
187
-
188
-
189
-
190
-
191
-
192
-
193
-
194
-
195
-
196
-
197
-
198
-
199
-
200
-
201
-
202
-
203
-
204
-
205
-
206
-
207
-
208
-
209
-
210
-
211
-
212
-
213
-
214
-
215
-
216
-
217
-
218
-
219
-
220
-
221
-
222
-
223
-
224
-
225
-
226
-
227
-
228
-
229
-
230
-
231
-
232
-
233
-
234
 |
 |
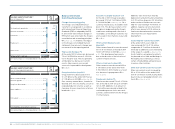
124 GROUP MANAGEMENT REPORT – FINANCIAL REVIEW GROUP BUSINESS PERFORMANCE Balance Sheet and Cash Flow Statement
Non-current accrued liabilities
down 41%
Non-current accrued liabilities declined
41% to € 22 million at the end of 2009
from € 37 million in 2008. This was partly
as a result of a decrease in the accruals
for goods and services not yet invoiced.
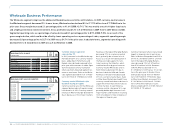
Equity grows due to full conversion
of convertible bond
Shareholders’ equity rose 11% to
€ 3.771 billion at the end of 2009 ver-
sus € 3.386 billion in 2008 see 41. The
full conversion of our convertible bond
and the net income generated during the
period were the main contributors to this
development. Declines in the fair value
of financial instruments, the dividend
paid during the period and currency
translation effects negatively impacted
this development see Note 26, p. 189.
Expenses related to off-balance
sheet items
Our most important off-balance sheet
commitments are operating leases,
which are related to retail stores, offices,
warehouses and equipment. The Group
has entered into various operating leases
as opposed to property acquisitions to
reduce exposure to property value fluc-
tuations. Rent expenses increased 14% to
€ 480 million in 2009 from € 422 million
in the prior year, mainly due to the con-
tinued expansion of the adidas Group’s
own-retail activities see Note 27, p. 193.
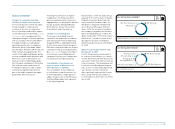
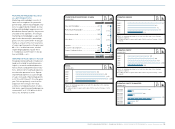
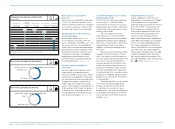
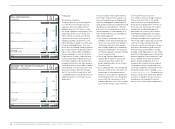
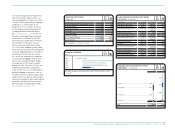
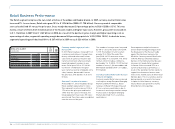
N
°-
42
CHANGE IN CASH AND CASH EQUIVALENTS
€ IN MILLIONS
Cash and cash
equivalents at
the end of 2008
Net cash
provided by
operating
activities
Net cash used
in investing
activities
Net cash used
in financing
activities
Cash and cash
equivalents at the
end of 2009 1 )
1) Includes a positive exchange rate effect of € 7 million.
244
1,198 (162)
(512)
775
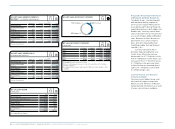
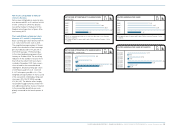
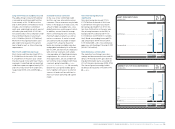
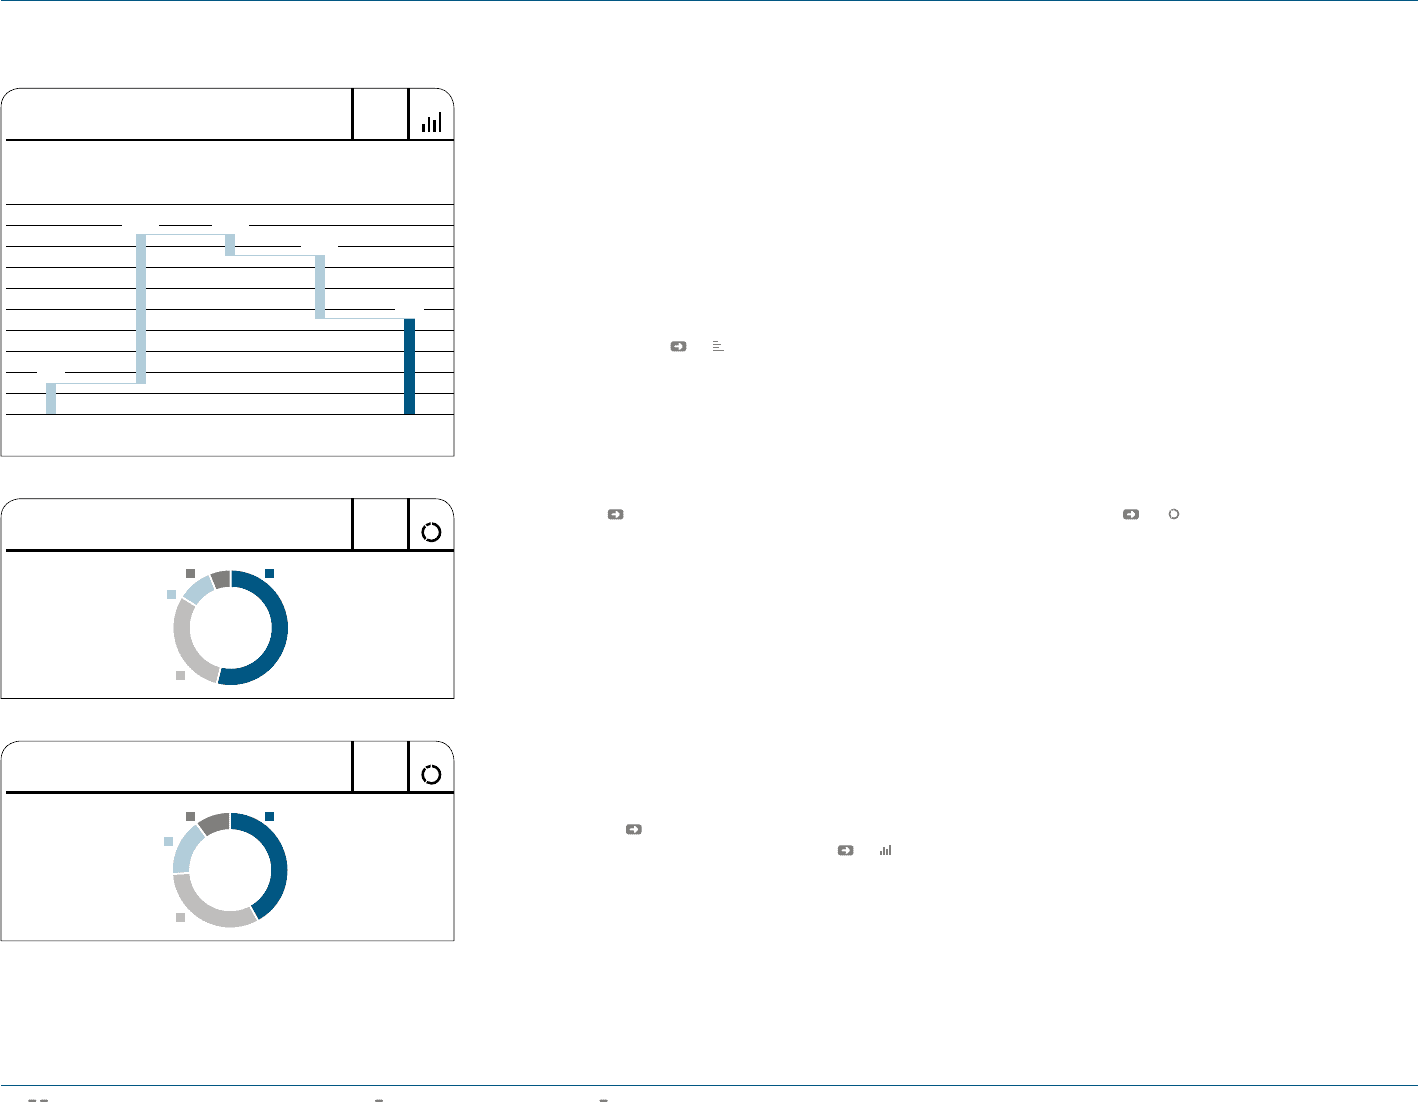
N
°-
43
N
°-
44
2009 CAPITAL EXPENDITURE BY SEGMENT
2009 CAPITAL EXPENDITURE BY TYPE
10% Wholesale
16% IT
30% Retail
32% Own retail
6% Other Businesses
10% Retailer support
54% HQ/Consolidation
42% Other
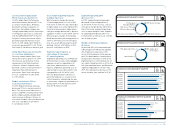
Cash flow development reflects lower
working capital needs
In 2009, net cash inflow from operating
activities was € 1.198 billion (2008:
€ 497 million). The increase in cash pro-
vided by operating activities compared to
the prior year was primarily due to lower
working capital needs.
Net cash outflow from invest-
ing activities was € 162 million (2008:
€ 444 million) and was mainly related to
spending for property, plant and equip-
ment such as investments in the furnish-
ing and fitting of stores in our Retail
segment, in new office buildings and in
IT systems.
Net cash used in financing activities
totalled € 512 million (2008: € 106 mil-
lion). Cash inflows from financing activi-
ties were mainly related to proceeds from
the issue of a five-year Eurobond in a
nominal amount of € 500 million. Cash
outflows from financing activities in an
amount of € 508 million and € 404 mil-
lion were attributable to the repayment
of long-term and short-term borrowings,
respectively. In addition, adidas AG paid
dividends in an amount of € 97 million to
its shareholders.
Exchange rate effects in an amount
of € 7 million positively impacted the
Group’s cash position in 2009 (2008:
€ 2 million). As a result of all these
developments, cash and cash equivalents
increased by € 531 million to € 775 mil-
lion at the end of 2009 (2008: € 244 mil-
lion) see 42.
Capital expenditure reduced
Capital expenditure is the total cash
expenditure for the purchase of tangible
and intangible assets. Group capital
expenditure decreased 37% to € 240 mil-
lion in 2009 (2008: € 380 million). The
Retail segment accounted for 30% of
Group capital expenditure (2008: 36%).
Investments primarily related to the
expansion of our store base for the
adidas and Reebok brands. Expenditure
in the Wholesale segment accounted for
10% of total capital expenditure (2008:
7%). Capital expenditure in Other Busi-
nesses accounted for 6% of total expend-
iture (2008: 5%). The remaining 54% of
Group capital expenditure was recorded
in HQ/Consolidation (2008: 52%) and
was mainly related to investments into
new office buildings and IT infrastructure
see 43 and Global Operations, p. 88.