Reebok 2009 Annual Report Download - page 122
Download and view the complete annual report
Please find page 122 of the 2009 Reebok annual report below. You can navigate through the pages in the report by either clicking on the pages listed below, or by using the keyword search tool below to find specific information within the annual report.-
 1
1 -
2
-
3
-
4
-
5
-
6
-
7
-
8
-
9
-
10
-
11
-
12
-
13
-
14
-
15
-
16
-
17
-
18
-
19
-
20
-
21
-
22
-
23
-
24
-
25
-
26
-
27
-
28
-
29
-
30
-
31
-
32
-
33
-
34
-
35
-
36
-
37
-
38
-
39
-
40
-
41
-
42
-
43
-
44
-
45
-
46
-
47
-
48
-
49
-
50
-
51
-
52
-
53
-
54
-
55
-
56
-
57
-
58
-
59
-
60
-
61
-
62
-
63
-
64
-
65
-
66
-
67
-
68
-
69
-
70
-
71
-
72
-
73
-
74
-
75
-
76
-
77
-
78
-
79
-
80
-
81
-
82
-
83
-
84
-
85
-
86
-
87
-
88
-
89
-
90
-
91
-
92
-
93
-
94
-
95
-
96
-
97
-
98
-
99
-
100
-
101
-
102
-
103
-
104
-
105
-
106
-
107
-
108
-
109
-
110
-
111
-
 112
112 -
 113
113 -
 114
114 -
 115
115 -
 116
116 -
 117
117 -
 118
118 -
 119
119 -
 120
120 -
 121
121 -
 122
122 -
 123
123 -
 124
124 -
 125
125 -
 126
126 -
 127
127 -
 128
128 -
 129
129 -
 130
130 -
 131
131 -
 132
132 -
133
-
134
-
135
-
136
-
137
-
138
-
139
-
140
-
141
-
142
-
143
-
144
-
145
-
146
-
147
-
148
-
149
-
150
-
151
-
152
-
153
-
154
-
155
-
156
-
157
-
158
-
159
-
160
-
161
-
162
-
163
-
164
-
165
-
166
-
167
-
168
-
169
-
170
-
171
-
172
-
173
-
174
-
175
-
176
-
177
-
178
-
179
-
180
-
181
-
182
-
183
-
184
-
185
-
186
-
187
-
188
-
189
-
190
-
191
-
192
-
193
-
194
-
195
-
196
-
197
-
198
-
199
-
200
-
201
-
202
-
203
-
204
-
205
-
206
-
207
-
208
-
209
-
210
-
211
-
212
-
213
-
214
-
215
-
216
-
217
-
218
-
219
-
220
-
221
-
222
-
223
-
224
-
225
-
226
-
227
-
228
-
229
-
230
-
231
-
232
-
233
-
234
 |
 |
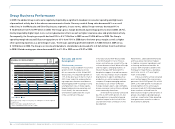
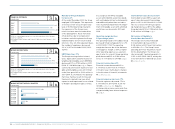
118 GROUP MANAGEMENT REPORT – FINANCIAL REVIEW GROUP BUSINESS PERFORMANCE Income Statement
N
°-
1 9
N
°-
20
N
°-
21
N
°-
22
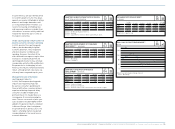
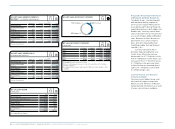
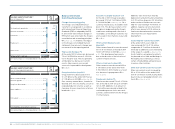
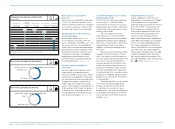
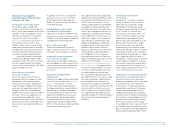
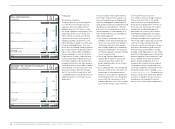
OTHER OPERATING EXPENSES
€ IN MILLIONS
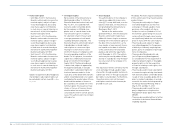
OTHER OPERATING EXPENSES
IN % OF NET SALES
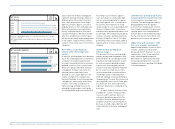
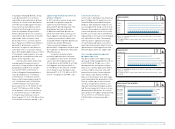
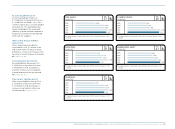
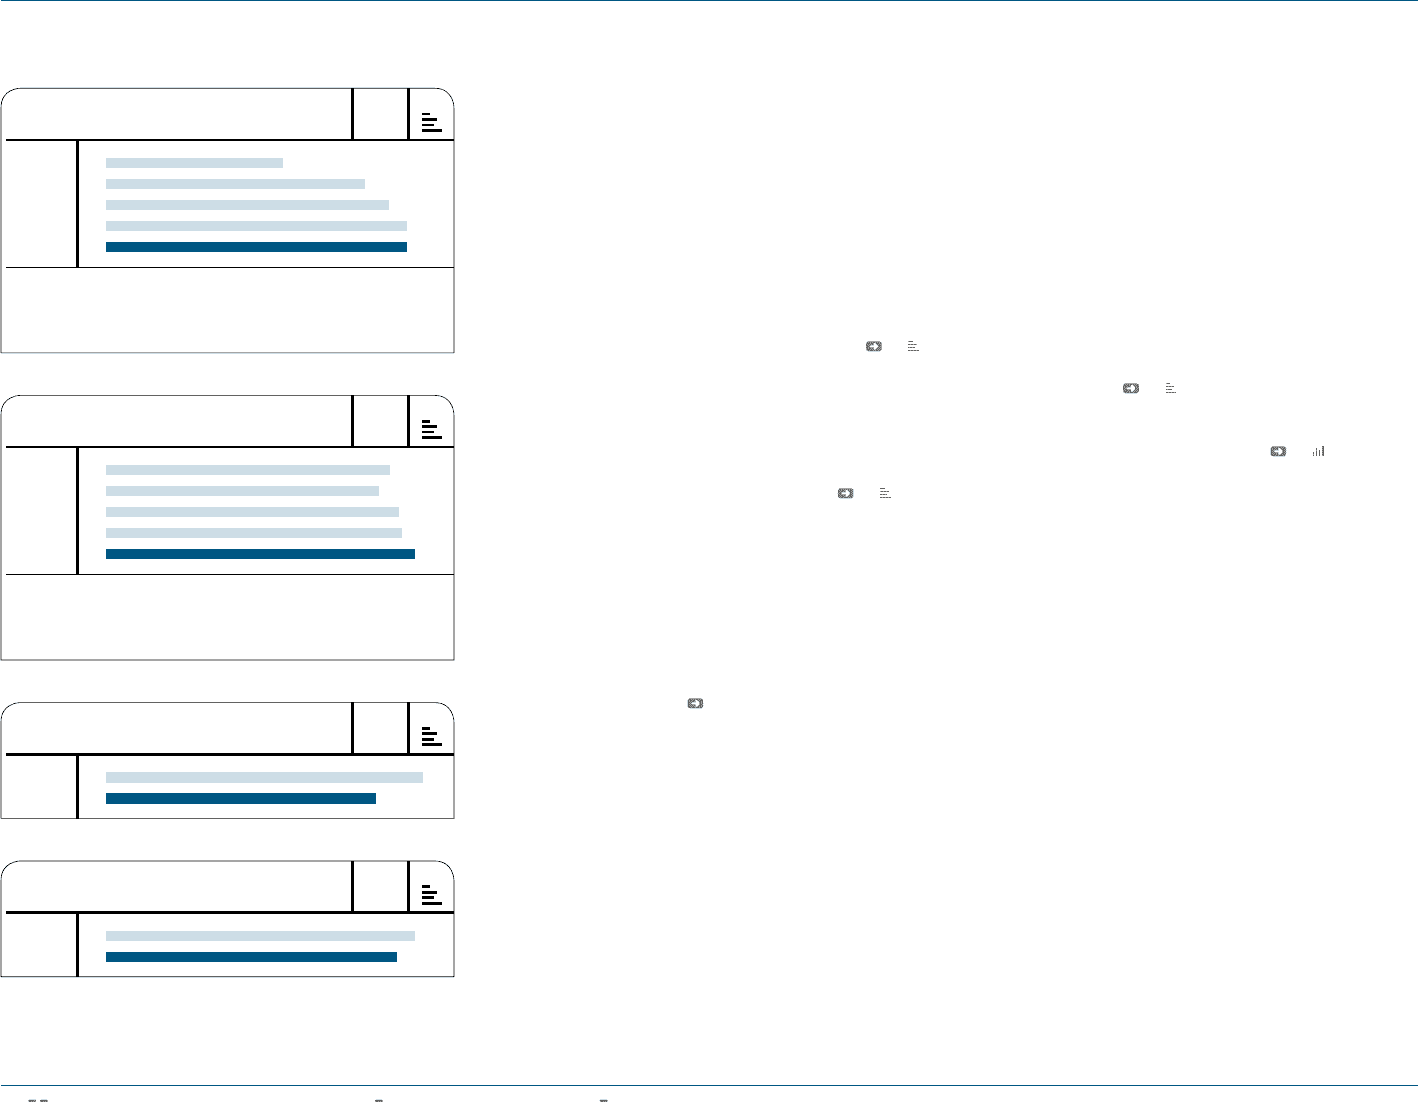
SALES WORKING BUDGET
IN % OF NET SALES
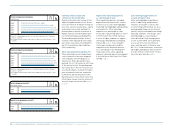
MARKETING WORKING BUDGET
IN % OF NET SALES
2005 1 )
2006 2 )
2007
2008
2009
2005 1 )
2006 2 )
2007
2008
2009
2008
2009
2008
2009
2,573
3,759
4,115
4,378
4,390
38.8
37.3
40.0
40.5
42.3
2.7
2.3
10.5
9.9
1) Reflects continuing operations as a result of the divestiture of the Salomon
business segment.
2) Including Reebok, Rockport and Reebok-CCM Hockey from February 1, 2006
onwards.
1) Reflects continuing operations as a result of the divestiture of the Salomon
business segment.
2) Including Reebok, Rockport and Reebok-CCM Hockey from February 1, 2006
onwards.
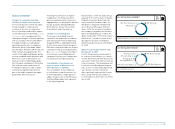
Currency-neutral royalty and
commission income declines
Royalty and commission income for the
adidas Group decreased 4% to € 86 mil-
lion in 2009 from € 89 million in the prior
year. On a currency-neutral basis, royalty
and commission income declined 7%,
primarily due to the non-recurrence of
Reebok royalties from distribution part-
ners in Brazil/Paraguay and Argentina.
The distribution partnerships in these
countries were replaced by own compa-
nies whose sales were consolidated for
the first time effective April and June
2008, respectively.
Other operating income declines 3%
Other operating income includes items
such as releases of accruals and provi-
sions and gains from the disposal of
fixed assets. Other operating income
declined 3% to € 100 million in 2009 from
€ 103 million in 2008. This development
was mainly due to the non-recurrence of
one-time book gains realised in the prior
year in connection with the acquisition
of Ashworth and the divestiture of the
Maxfli business. These effects more than
offset higher income from the release of
accruals for personnel costs see Note
29, p. 201.
Higher other operating expenses
as a percentage of sales
Other operating expenses, including
depreciation and amortisation, consist
of items such as sales working budget,
marketing working budget and operating
overhead costs. Other operating
expenses as a percentage of sales
increased 1.7 percentage points to 42.3%
in 2009 from 40.5% in 2008, mainly as
a result of higher expenses to support
the Group’s development in emerging
markets see 20. Costs related to
the Group’s reorganisation and the
integration of the Ashworth business
also contributed to this development.
In absolute terms, other operating
expenses remained almost unchanged at
€ 4.390 billion in 2009 (2008: € 4.378 bil-
lion) see 19.
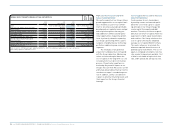
Sales working budget decreases
as a percentage of sales
Sales working budget expenditures
relate to advertising and promotion
initiatives at the point of sale as well
as store fittings and furniture. As sales
working budget expenses are channel
specific, they are allocated to the Group’s
operating segments. The Group’s sales
working budget as a percentage of
sales decreased 0.4 percentage points
to 2.3% in 2009 (2008: 2.7%), primarily
as a result of the non-recurrence of
major sporting events in the prior year
see 21. In absolute terms, sales work-
ing budget expenditures decreased 19%
to € 241 million in 2009 from € 297 mil-
lion in the prior year see 23.