PNC Bank 2006 Annual Report Download - page 80
Download and view the complete annual report
Please find page 80 of the 2006 PNC Bank annual report below. You can navigate through the pages in the report by either clicking on the pages listed below, or by using the keyword search tool below to find specific information within the annual report.-
 1
1 -
2
-
3
-
4
-
5
-
6
-
7
-
8
-
9
-
10
-
11
-
12
-
13
-
14
-
15
-
16
-
17
-
18
-
19
-
20
-
21
-
22
-
23
-
24
-
25
-
26
-
27
-
28
-
29
-
30
-
31
-
32
-
33
-
34
-
35
-
36
-
37
-
38
-
39
-
40
-
41
-
42
-
43
-
44
-
45
-
46
-
47
-
48
-
49
-
50
-
51
-
52
-
53
-
54
-
55
-
56
-
57
-
58
-
59
-
60
-
61
-
62
-
63
-
64
-
65
-
66
-
67
-
68
-
69
-
 70
70 -
 71
71 -
 72
72 -
 73
73 -
 74
74 -
 75
75 -
 76
76 -
 77
77 -
 78
78 -
 79
79 -
 80
80 -
 81
81 -
 82
82 -
 83
83 -
 84
84 -
 85
85 -
 86
86 -
 87
87 -
 88
88 -
 89
89 -
 90
90 -
91
-
92
-
93
-
94
-
95
-
96
-
97
-
98
-
99
-
100
-
101
-
102
-
103
-
104
-
105
-
106
-
107
-
108
-
109
-
110
-
111
-
112
-
113
-
114
-
115
-
116
-
117
-
118
-
119
-
120
-
121
-
122
-
123
-
124
-
125
-
126
-
127
-
128
-
129
-
130
-
131
-
132
-
133
-
134
-
135
-
136
-
137
-
138
-
139
-
140
-
141
-
142
-
143
-
144
-
145
-
146
-
147
 |
 |

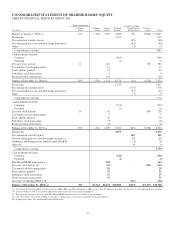
CONSOLIDATED STATEMENT OF SHAREHOLDERS’ EQUITY
THE PNC FINANCIAL SERVICES GROUP, INC.
Shares Outstanding
Common
Stock
Capital
Surplus
Retained
Earnings
Accumulated Other
Comprehensive
Income (Loss)
Treasury
Stock TotalIn millions
Common
Stock
Balance at January 1, 2004 (a) 277 1,764 1,079 7,642 60 (3,900) $ 6,645
Net income 1,197 1,197
Net unrealized securities losses (69) (69)
Net unrealized losses on cash flow hedge derivatives (42) (42)
Other (3) (3)
Comprehensive income 1,083
Cash dividends declared
Common (565) (565)
Preferred (1) (1)
Treasury stock activity 6 116 176 292
Tax benefit of stock option plans 15 15
Stock options granted 22 22
Subsidiary stock transactions 4 4
Restricted stock transactions (22) (22)
Balance at December 31, 2004 (a) 283 1,764 1,214 8,273 (54) (3,724) 7,473
Net income 1,325 1,325
Net unrealized securities losses (174) (174)
Net unrealized losses on cash flow hedge derivatives (32) (32)
Other (7) (7)
Comprehensive income 1,112
Cash dividends declared
Common (574) (574)
Preferred (1) (1)
Treasury stock activity 10 61 468 529
Tax benefit of stock option plans 7 7
Stock options granted 30 30
Subsidiary stock transactions (5) (5)
Restricted stock transactions (8) (8)
Balance at December 31, 2005 (a) 293 1,764 1,299 9,023 (267) (3,256) 8,563
Net income 2,595 2,595
Net unrealized securities gains 149 149
Net unrealized gains on cash flow hedge derivatives 13 13
Additional minimum pension liability under SFAS 87 (1) (1)
Other (b) 33
Comprehensive income 2,759
Cash dividends declared
Common (632) (632)
Preferred (1) (1)
BlackRock/MLIM transaction (c) 262 ` 262
Treasury stock activity (d) (12) (121) (133)
Tax benefit of stock option plans 29 29
Stock options granted 31 31
Subsidiary stock transactions 27 27
Restricted stock transactions 15 15
Net effect of adopting SFAS 158 (132) (132)
Balance at December 31, 2006 (a) 293 $1,764 $1,651 $10,985 $(235) $(3,377) $10,788
(a) Our preferred stock outstanding as of December 31, 2006, 2005, and 2004 and January 1, 2004 was less than $.5 million at each date and, therefore, is excluded from this presentation.
(b) Consists of interest-only strip valuation adjustments and foreign currency translation adjustments.
(c) Represents the portion of our gain on the BlackRock/MLIM transaction that was credited to capital surplus.
(d) Our net treasury stock activity in 2006 was less than .1 million shares issued and is excluded from this presentation.
See accompanying Notes To Consolidated Financial Statements.
70