PNC Bank 2006 Annual Report Download - page 113
Download and view the complete annual report
Please find page 113 of the 2006 PNC Bank annual report below. You can navigate through the pages in the report by either clicking on the pages listed below, or by using the keyword search tool below to find specific information within the annual report.-
 1
1 -
2
-
3
-
4
-
5
-
6
-
7
-
8
-
9
-
10
-
11
-
12
-
13
-
14
-
15
-
16
-
17
-
18
-
19
-
20
-
21
-
22
-
23
-
24
-
25
-
26
-
27
-
28
-
29
-
30
-
31
-
32
-
33
-
34
-
35
-
36
-
37
-
38
-
39
-
40
-
41
-
42
-
43
-
44
-
45
-
46
-
47
-
48
-
49
-
50
-
51
-
52
-
53
-
54
-
55
-
56
-
57
-
58
-
59
-
60
-
61
-
62
-
63
-
64
-
65
-
66
-
67
-
68
-
69
-
70
-
71
-
72
-
73
-
74
-
75
-
76
-
77
-
78
-
79
-
80
-
81
-
82
-
83
-
84
-
85
-
86
-
87
-
88
-
89
-
90
-
91
-
92
-
93
-
94
-
95
-
96
-
97
-
98
-
99
-
100
-
101
-
102
-
 103
103 -
 104
104 -
 105
105 -
 106
106 -
 107
107 -
 108
108 -
 109
109 -
 110
110 -
 111
111 -
 112
112 -
 113
113 -
 114
114 -
 115
115 -
 116
116 -
 117
117 -
 118
118 -
 119
119 -
 120
120 -
 121
121 -
 122
122 -
 123
123 -
124
-
125
-
126
-
127
-
128
-
129
-
130
-
131
-
132
-
133
-
134
-
135
-
136
-
137
-
138
-
139
-
140
-
141
-
142
-
143
-
144
-
145
-
146
-
147
 |
 |

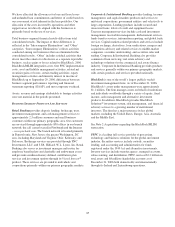
The guidelines also indicate which investments and strategies
the manager is permitted to use to achieve its performance
objectives, and which investments and strategies it is
prohibited from using.
Where public market investment strategies may include the
use of derivatives and/or currency management, language is
incorporated in the managers’ guidelines to define allowable
and prohibited transactions and/or strategies. Derivatives are
typically employed by investment managers to modify risk/
return characteristics of their portfolio(s), implement asset
allocation changes in a cost-effective manner, or reduce
transaction costs. Under the managers’ investment guidelines,
derivatives may not be used solely for speculation or leverage.
Derivatives are used only in circumstances where they offer
the most efficient economic means of improving the risk/
reward profile of the portfolio.
BlackRock, PFPC and our Retail Banking business segment
receive compensation for providing investment management,
trustee and custodial services for the majority of the Trust
portfolio. Compensation for such services is paid by PNC.
Non-affiliate service providers for the Trust are compensated
from plan assets.
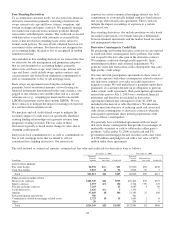
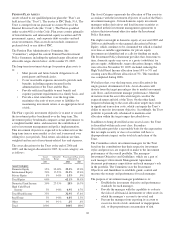
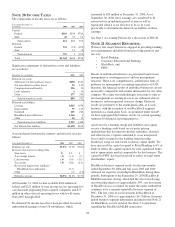
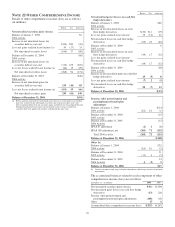
The following table provides information regarding our
estimated future cash flows related to our various plans:
Estimated Cash Flows
Postretirement Benefits
In millions
Qualified
Pension
Nonqualified
Pension
Gross PNC
Benefit Payments
Reduction in
PNC Benefit
Payments Due
to Medicare Part
D Subsidy
Estimated 2007
employer
contributions None $8 $24 $2
Estimated future
benefit
payments
2007 $107 $8 $24 $2
2008 111 9 24 2
2009 117 9 24 2
2010 116 10 24 2
2011 121 9 24 2
2012 – 2016 589 34 113 9
The qualified pension plan contributions are deposited into the
Trust, and the qualified pension plan benefit payments are
paid from the Trust. For the other plans, total contributions
and the benefit payments are the same and represent expected
benefit amounts, which are paid from general assets.
Postretirement benefits are net of participant contributions.
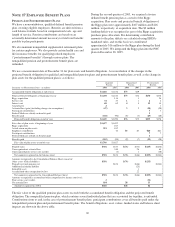
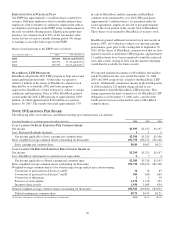
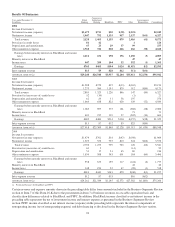
The components of net periodic pension and postretirement benefit cost/(income) were as follows:
Qualified Pension Plan Nonqualified Pension Plan Postretirement Benefits
Year ended December 31 – in millions 2006 2005 2004 2006 2005 2004 2006 2005 2004
Service cost $34 $33 $35 $1 $1 $1 $2 $2 $3
Interest cost 68 65 65 44413 14 17
Expected return on plan assets (129) (128) (112)
Amortization of prior service cost (1) (1) (1) (6) (7) (6)
Amortization of actuarial losses (gains) 16 23 23 333 145
Curtailment (gain) (1)
Net periodic cost $(12) $(8) $9 $8 $8 $8 $10 $13 $19
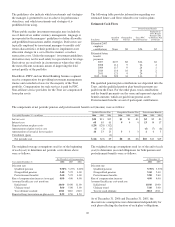
The weighted-average assumptions used (as of the beginning
of each year) to determine net periodic costs shown above
were as follows:
Net Periodic Cost Determination
Year ended December 31 2006 2005 2004
Discount rate
Qualified pension 5.50% 5.25% 6.00%
Nonqualified pension 5.40 5.25 6.00
Postretirement benefits 5.60 5.25 6.00
Rate of compensation increase (average) 4.00 4.00 4.00
Assumed health care cost trend rate
Initial trend 10.00 10.00 11.00
Ultimate trend 5.00 5.00 5.00
Year ultimate reached 2011 2010 2010
Expected long-term return on plan assets 8.25 8.50 8.50
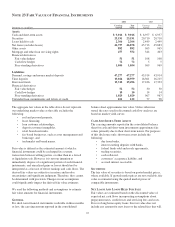
The weighted-average assumptions used (as of the end of each
year) to determine year-end obligations for both pension and
postretirement benefits were as follows:
At December 31
2006 2005
Discount rate
Qualified pension 5.70% 5.50%
Nonqualified pension 5.60 5.40
Postretirement benefits 5.80 5.60
Rate of compensation increase 4.00 4.00
Assumed health care cost trend rate
Initial trend 10.00 10.00
Ultimate trend 5.00 5.00
Year to reach ultimate 2012 2011
As of December 31, 2006 and December 31, 2005, the
discount rate assumptions were determined independently for
each plan reflecting the duration of each plan’s obligations.
103