PNC Bank 2006 Annual Report Download - page 65
Download and view the complete annual report
Please find page 65 of the 2006 PNC Bank annual report below. You can navigate through the pages in the report by either clicking on the pages listed below, or by using the keyword search tool below to find specific information within the annual report.-
 1
1 -
2
-
3
-
4
-
5
-
6
-
7
-
8
-
9
-
10
-
11
-
12
-
13
-
14
-
15
-
16
-
17
-
18
-
19
-
20
-
21
-
22
-
23
-
24
-
25
-
26
-
27
-
28
-
29
-
30
-
31
-
32
-
33
-
34
-
35
-
36
-
37
-
38
-
39
-
40
-
41
-
42
-
43
-
44
-
45
-
46
-
47
-
48
-
49
-
50
-
51
-
52
-
53
-
54
-
 55
55 -
 56
56 -
 57
57 -
 58
58 -
 59
59 -
 60
60 -
 61
61 -
 62
62 -
 63
63 -
 64
64 -
 65
65 -
 66
66 -
 67
67 -
 68
68 -
 69
69 -
 70
70 -
 71
71 -
 72
72 -
 73
73 -
 74
74 -
 75
75 -
76
-
77
-
78
-
79
-
80
-
81
-
82
-
83
-
84
-
85
-
86
-
87
-
88
-
89
-
90
-
91
-
92
-
93
-
94
-
95
-
96
-
97
-
98
-
99
-
100
-
101
-
102
-
103
-
104
-
105
-
106
-
107
-
108
-
109
-
110
-
111
-
112
-
113
-
114
-
115
-
116
-
117
-
118
-
119
-
120
-
121
-
122
-
123
-
124
-
125
-
126
-
127
-
128
-
129
-
130
-
131
-
132
-
133
-
134
-
135
-
136
-
137
-
138
-
139
-
140
-
141
-
142
-
143
-
144
-
145
-
146
-
147
 |
 |
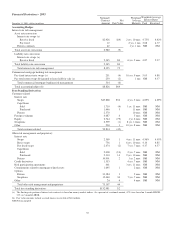
In addition to measuring the effect on net interest income
assuming parallel changes in current interest rates, we
routinely simulate the effects of a number of nonparallel
interest rate environments. The following Net Interest Income
Sensitivity To Alternative Rate Scenarios table reflects the
percentage change in net interest income over the next two
12-month periods assuming (i) the PNC Economist’s most
likely rate forecast, (ii) implied market forward rates, and
(iii) a Two-Ten Inversion (a 200 basis point inversion between
two-year and ten-year rates superimposed on current base
rates) scenario. We are inherently sensitive to a flatter or
inverted yield curve.
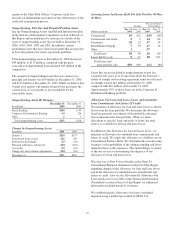
Net Interest Income Sensitivity To Alternative Rate
Scenarios (as of December 31, 2006)
PNC
Economist
Market
Forward
Two-Ten
Inversion
First year sensitivity 2.3% 1.6% (6.6)%
Second year sensitivity 8.4% 4.9% (6.1)%
All changes in forecasted net interest income are relative to
results in a base rate scenario where current market rates are
assumed to remain unchanged over the forecast horizon.
When forecasting net interest income, we make assumptions
about interest rates and the shape of the yield curve, the
volume and characteristics of new business, and the behavior
of existing positions. These assumptions determine the future
level of simulated net interest income in the base interest rate
scenario and the other interest rate scenarios presented in the
following table. These simulations assume that as assets and
liabilities mature, they are replaced or repriced at market rates.
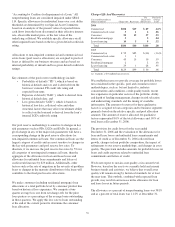
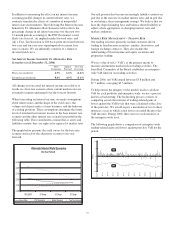
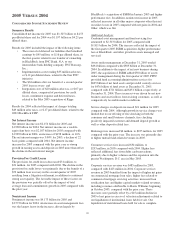
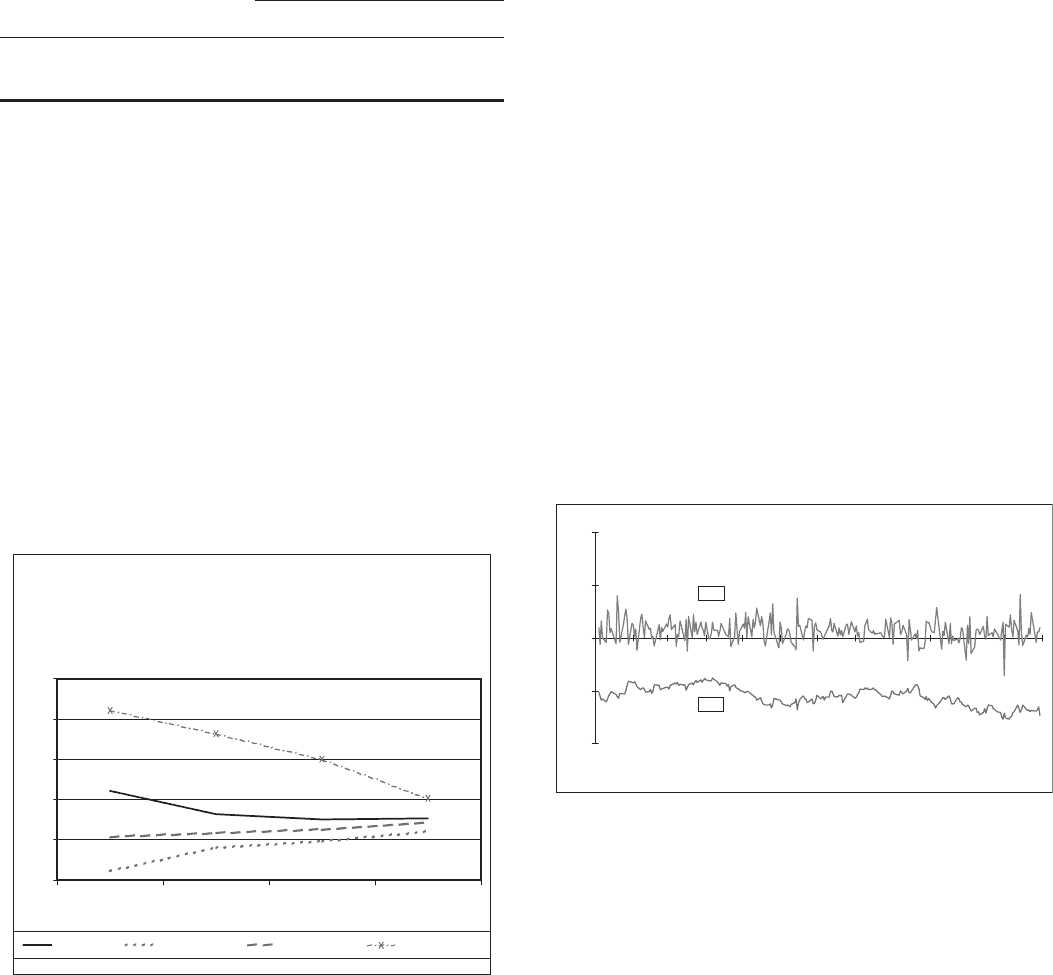
The graph below presents the yield curves for the base rate
scenario and each of the alternative scenarios one year
forward.
Alternate Interest Rate Scenarios
One Year Forward
4.25
4.75
5.25
5.75
6.25
6.75
1M LIBOR
Base Rates PNC Economist Market Forward Two-Ten Inversion
2Y Swap 3Y Swap 5Y Swap
Our risk position has become increasingly liability sensitive in
part due to the increase in market interest rates and in part due
to our balance sheet management strategy. We believe that we
have the deposit funding base and balance sheet flexibility to
adjust, where appropriate, to changing interest rates and
market conditions.
M
ARKET
R
ISK
M
ANAGEMENT
–T
RADING
R
ISK
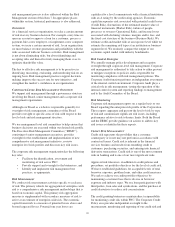
Our trading activities primarily include customer-driven
trading in fixed income securities, equities, derivatives, and
foreign exchange contracts. They also include the
underwriting of fixed income and equity securities and
proprietary trading.
We use value-at-risk (“VaR”) as the primary means to
measure and monitor market risk in trading activities. The
Joint Risk Committee of the Board establishes an enterprise-
wide VaR limit on our trading activities.
During 2006, our VaR ranged between $3.8 million and
$7.7 million, averaging $5.5 million.
To help ensure the integrity of the models used to calculate
VaR for each portfolio and enterprise-wide, we use a process
known as backtesting. The backtesting process consists of
comparing actual observations of trading-related gains or
losses against the VaR levels that were calculated at the close
of the prior day. We would expect a maximum of two to three
instances a year in which actual losses exceeded the prior day
VaR measure. During 2006, there were no such instances at
the enterprise-wide level.
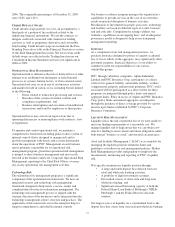
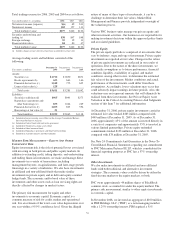
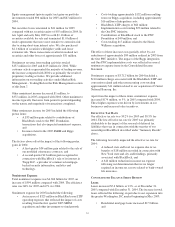
The following graph shows a comparison of enterprise-wide
trading-related gains and losses against prior day VaR for the
period.
Enterprise-Wide Trading-Related Gains/Losses Versus Value at Risk YTD 2006
(10)
(5)
0
5
10
12/31/05
1/31/06
2/28/06
3/31/06
4/30/06
5/31/06
6/30/06
7/31/06
8/31/06
9/30/06
10/31/06
11/30/06
12/31/06
Millions
VaR
P&L
55